
Fig. 1. μSR spectroscopy applied to CrI3.
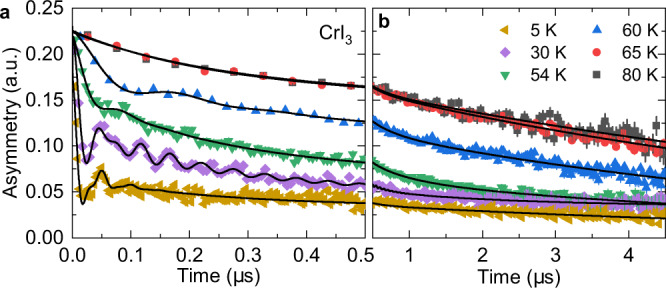
a, b Zero-field μSR spectra recorded at various temperatures for the polycrystalline sample of CrI3 shown in the low and extended time interval. The solid lines are the fit of the data using the methods of Supplementary Note 2. Error bars are the standard error of the mean in about ~ 106 events. The error of each bin count is given by the standard deviation of n. The errors of each bin in the μSR asymmetry are then calculated by statistical error propagation.