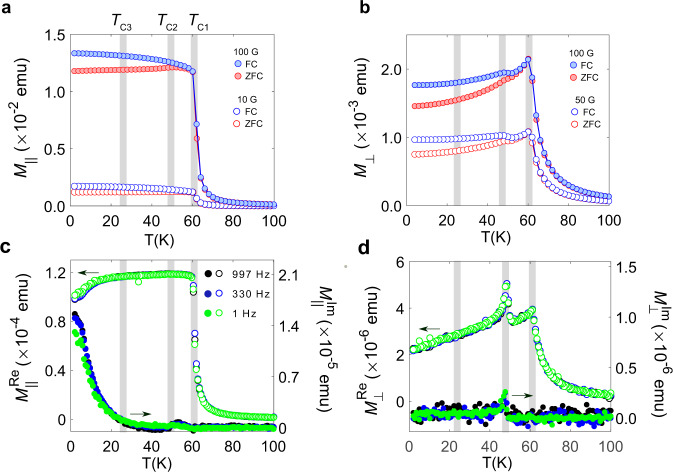
Fig. 3. SQUID magnetometry.
a-b, Zero field cooled (ZFC) and field cooled (FC) temperature dependences of the DC magnetization M at external magnetic fields (10 G, 50 G, 100 G) aligned parallel (M∥) and perpendicular (M⊥) to the crystallographic c-axis, respectively. The grey-shaded regions indicate the critical temperatures (TC1, TC2, TC3) where the phase transitions occur as observed on the μSR measurements. The solid lines are a guide to the eye. c-d, Zero-field temperature dependences of the AC magnetization at parallel and perpendicular orientations, respectively. Three different frequencies (997 Hz, 330 Hz, 1 Hz) are used for plotting the real (, ) and imaginary (, ) parts of the AC magnetization.

