Figure 2.
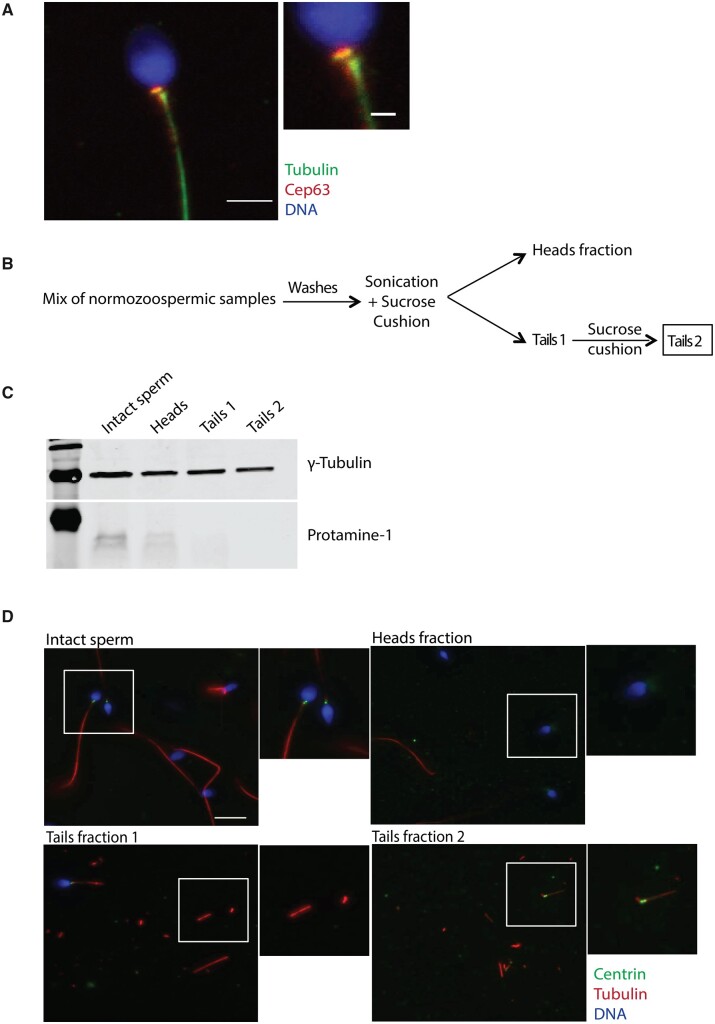
Sperm centrosome enrichment to identify centrosomal components. (A) IF images on human sperm to visualize Cep63, α-tubulin and DNA. Scale bar: 3 μm, inset: 1 μm. N = 4 different sperm samples. (B) Schematic representation of the sonication and enrichment protocol. Only normozoospermic samples with ≥50% of A + B motility were used. N = 3 different experiments. (C) Western blot analysis of cell lysates from the different sperm fractions shown in B to detect heads (protamine 1) and tails (γ-tubulin). N = 3 different experiments (see Supplementary Information for the uncropped blot). (D) Representative images of intact and sperm fractions stained for DNA (blue), centrin (green) and α-tubulin (red). Scale: 10 μm. N = 3 different experiments.

