Figure 6.
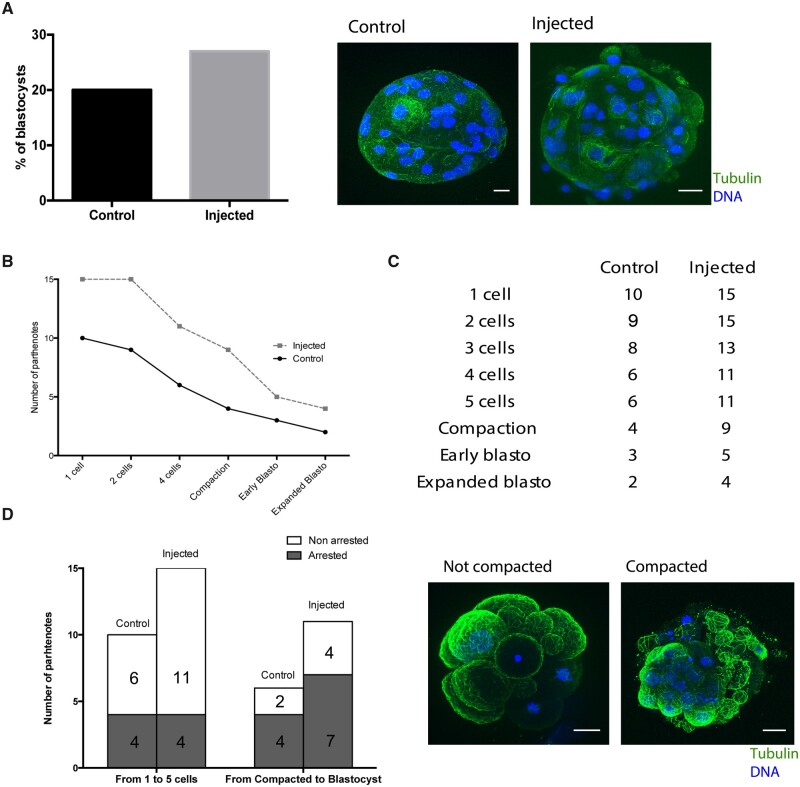
Sperm centrosome inheritance during fertilization ensures parthenotes compaction. (A) The graph on the left shows the percentage of parthenotes that form a blastocyst-like structure at D + 5 in controls and injected oocytes. The images on the right are representative pseudo-blastocysts obtained in control and injected oocytes. Scale: 20 μm. (B) Developmental progress of control versus injected parthenotes. The graph represents the number of parthenotes that achieved each cellular or embryonic stage. (C) Table with the number of control and injected parthenotes in each cellular and embryonic stage. (D) The graph on the left shows the rate of control and injected oocytes that arrested before or after compaction. On the right, representative images of non-compacted and compacted parthenotes. Scale: 20 μm. N = 10 control and N = 15 injected oocytes in 2 independent experiments.

