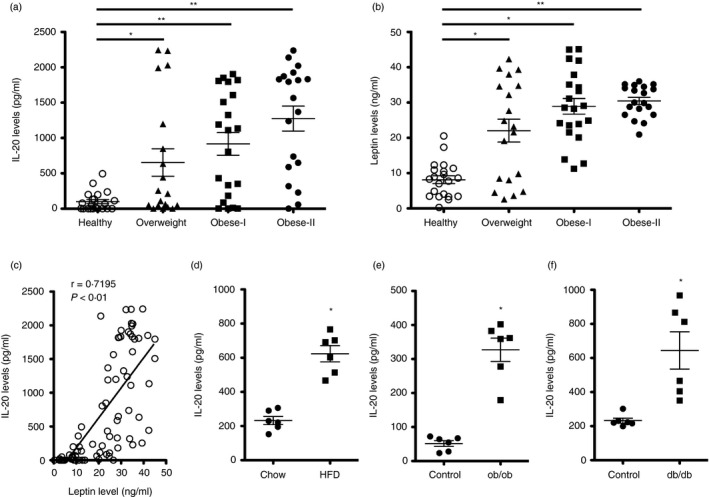
FIGURE 1.

Higher serum IL‐20 levels in obese patients and obese mice. (a‐b) Serum IL‐20 and leptin levels from 21 healthy controls (BMI: 18·5–24·9; age range: 25–49 years), 19 overweight patients (BMI: 25–29·9; age range: 47–77 years), 21 class I obese patients (BMI: 30–34·9; age range: 38–68 years) and 19 class II obese patients (BMI: 35–39·9; age range: 41–73 years) were analysed using ELISA. Horizontal lines represent means. Data are expressed as mean ±SD of triplicate samples from a single experiment and are representative of three independent experiments. *p < 0·05, **p < 0·01 compared with healthy controls. (c) Linear regression analysis of the correlation of serum IL‐20 and leptin levels in obese patients (r = 0·7195, p < 0·01). Data are expressed as mean ±SEM. (d) Serum IL‐20 levels in low‐fat diet (LFD) mice (fed standard mouse chow) (n = 6) or a high‐fat diet (HFD (n = 6) for 16 weeks. (e‐f) Serum IL‐20 levels in leptin (ob/ob)‐ and leptin receptor (db/db)‐deficient LFD mice (n = 6 mice per group) for 16 and 8 weeks, respectively. Horizontal lines represent means. Data are expressed as mean ±SD and are representative of three independent experiments. *p < 0·05 compared with control mice
