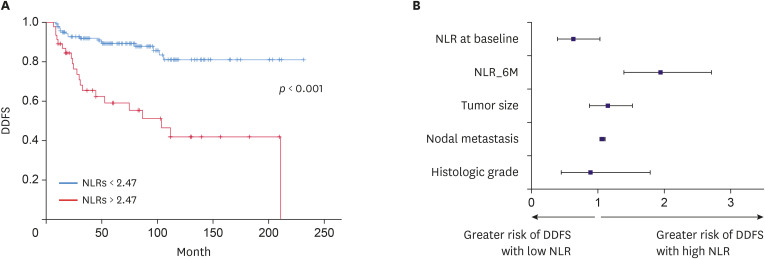
Figure 2. Survival difference between high and low NLRs at 6 months after treatment and contributing factors.
(A) The Kaplan-Meier curve generated to compare the difference in survival between high and low NLRs at 6 months after treatment completion shows statistically significant difference in DDFS (p < 0.001). (B) Risk factors predicting DDFS. Hazard ratios are estimated using the Cox proportional hazards model. The NLR at 6 months after treatment completion and nodal status are the only independent risk factors.
NLR = neutrophil-to-lymphocyte ratio; NLR_6M = NLR at 6 months after treatment completion; DDFS = distant disease-free survival.

