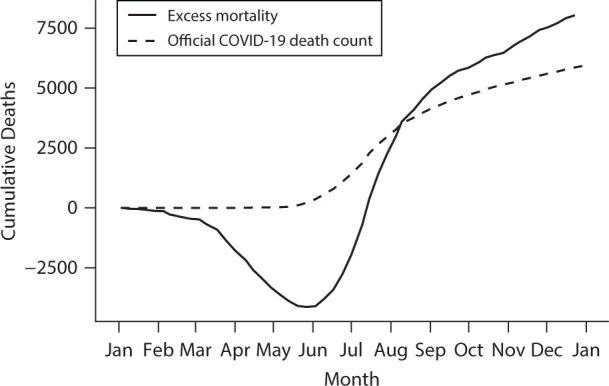
FIGURE 3—

Cumulative Excess Mortality Versus Official COVID-19 Mortality Count: Guatemala, 2020
Note. Vertical dashed line represents week 11, when the first case was detected in Guatemala. Line for 2015–2019 represents the average weekly mortality rate for that period.
