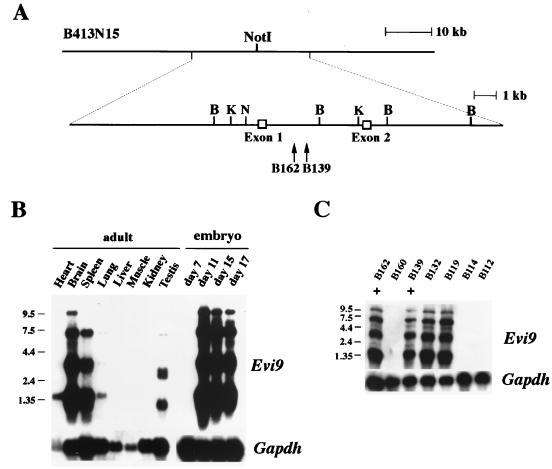
FIG. 1.
Identification of Evi9 transcripts. (A) Partial genomic structure of the 5′ region of Evi9. Exons 1 and 2 were trapped from the 90-kb BAC clone B413N15. B; BamHI, K; KpnI, N; NotI. Locations of the proviral integration sites in BXH2 leukemias B139 and B162 are shown by arrows. (B and C) Evi9 expression in normal adult and embryonic mouse tissue (B) and BXH2 leukemias (+ indicates leukemias with proviral integration at Evi9) (C). The blots were probed with Gapdh to normalize for RNA loading. Sizes of molecular weight markers in kilobases are shown on the left of each panel.

