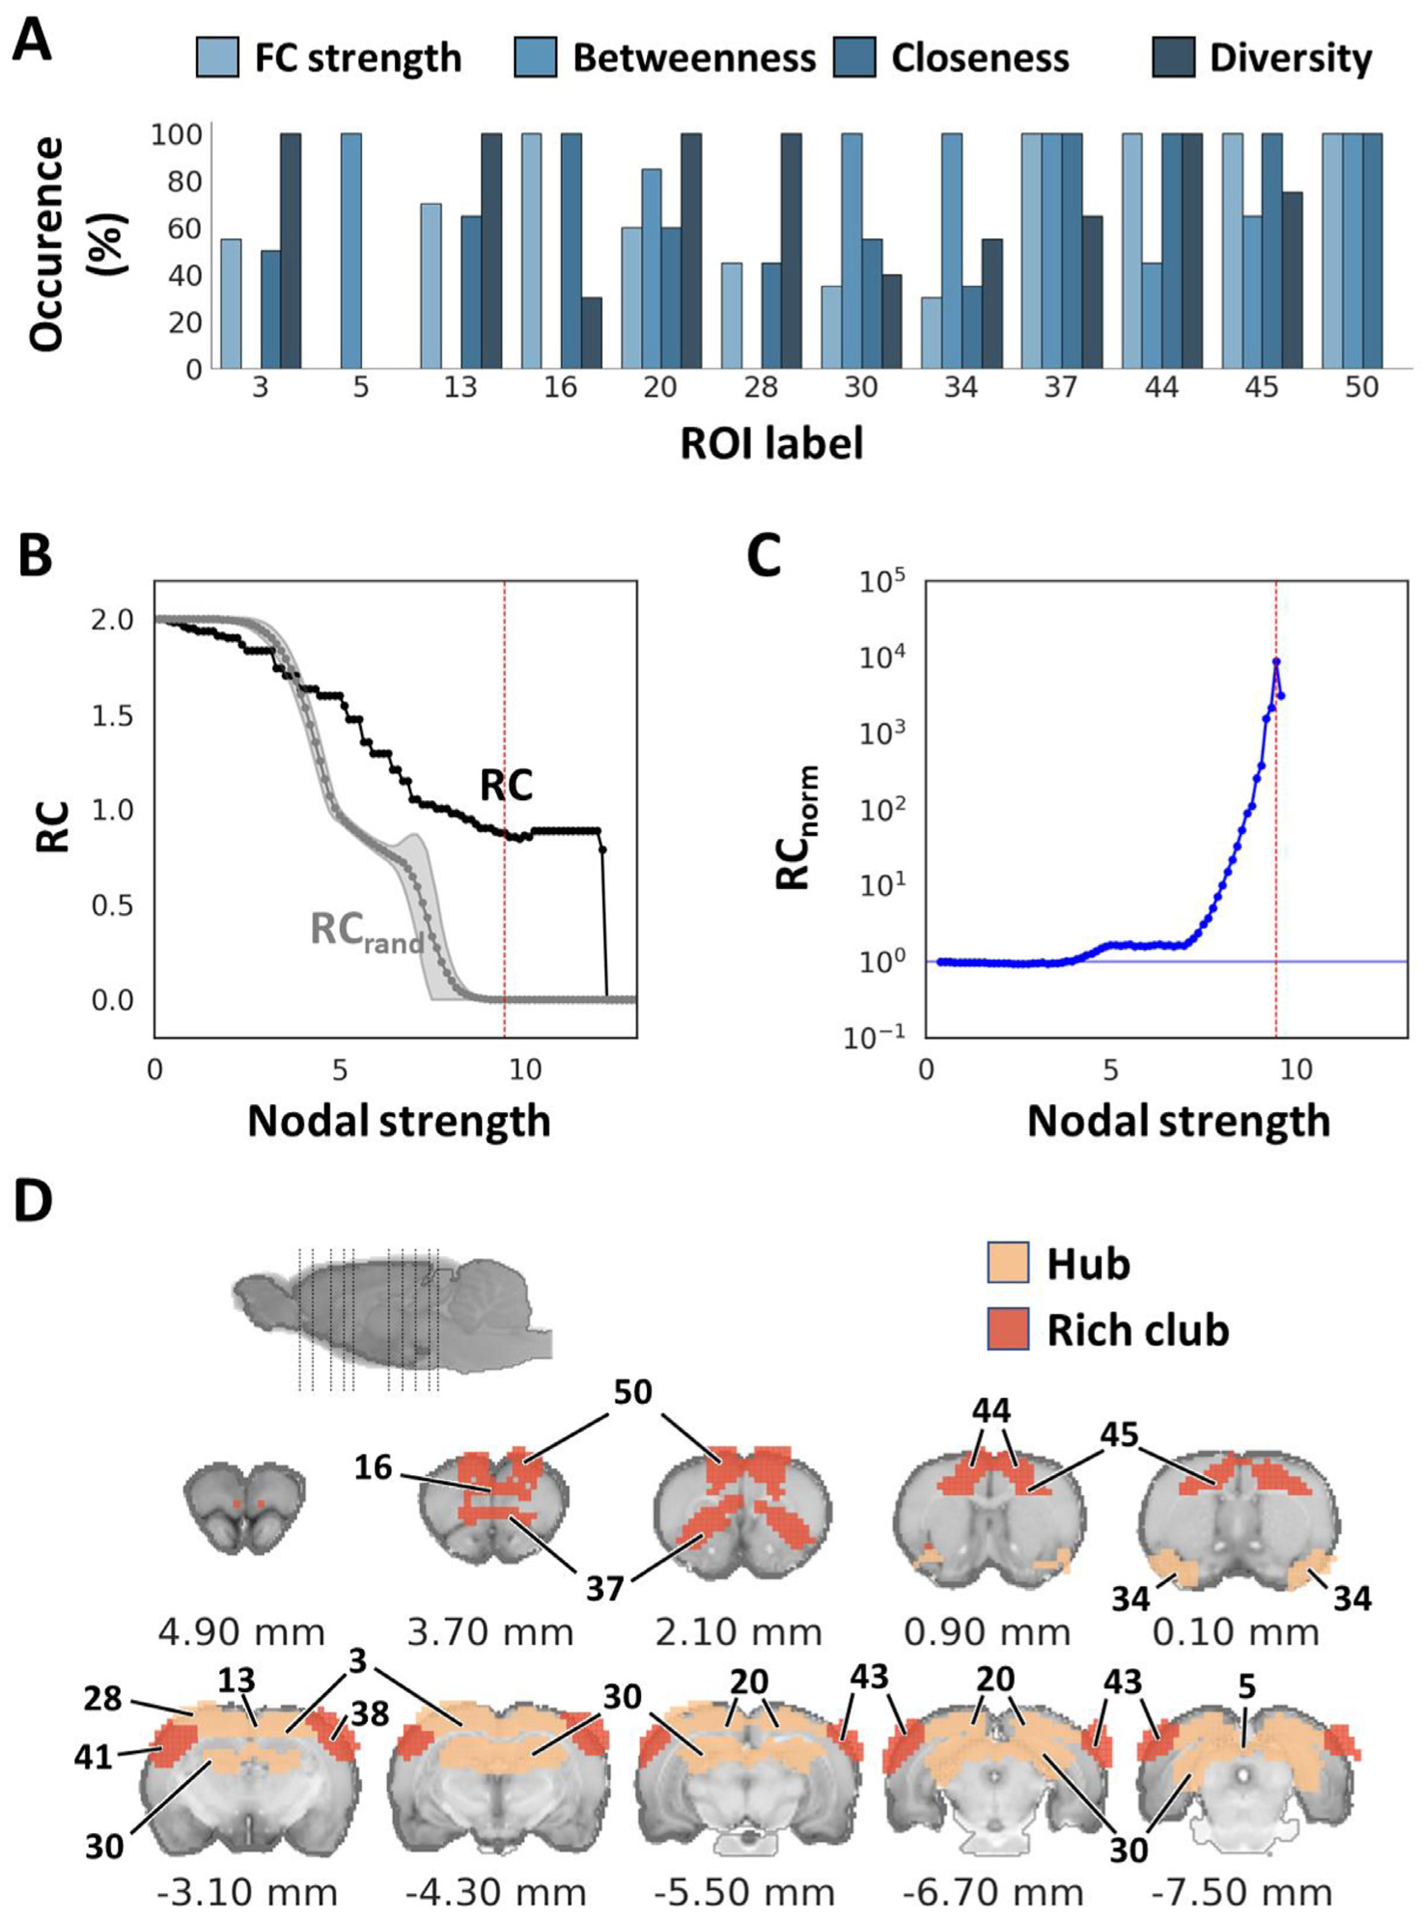
Fig. 13.

Identification of hub and rich club structures. (A) Percent occurrence of centrality metrics for each hub ROI. The ROIs that ranked at a high score of more than 90% on any of the centrality metrics among the thresholds throughout 5th to 25th among 50 ROIs, were determined as hubs. (B) Weighted rich club coefficient was calculated on the identified 50 ROIs. Black and gray curves compare the rich club coefficient at various nodal strengths between empirical and an average of 1,000 simulated random networks, respectively. (C) Normalized rich club coefficient calculated by RC/RC rand. Red vertical lines indicate the significant nodal strength used to identify rich club structures (p < 1.96 × 10−110). (D) Illustration of hub and rich club structures in the Paxinos and Watson’s (7th edition) rat brain coordinates (0 mm indicate bregma location). RC: rich club coefficient.
