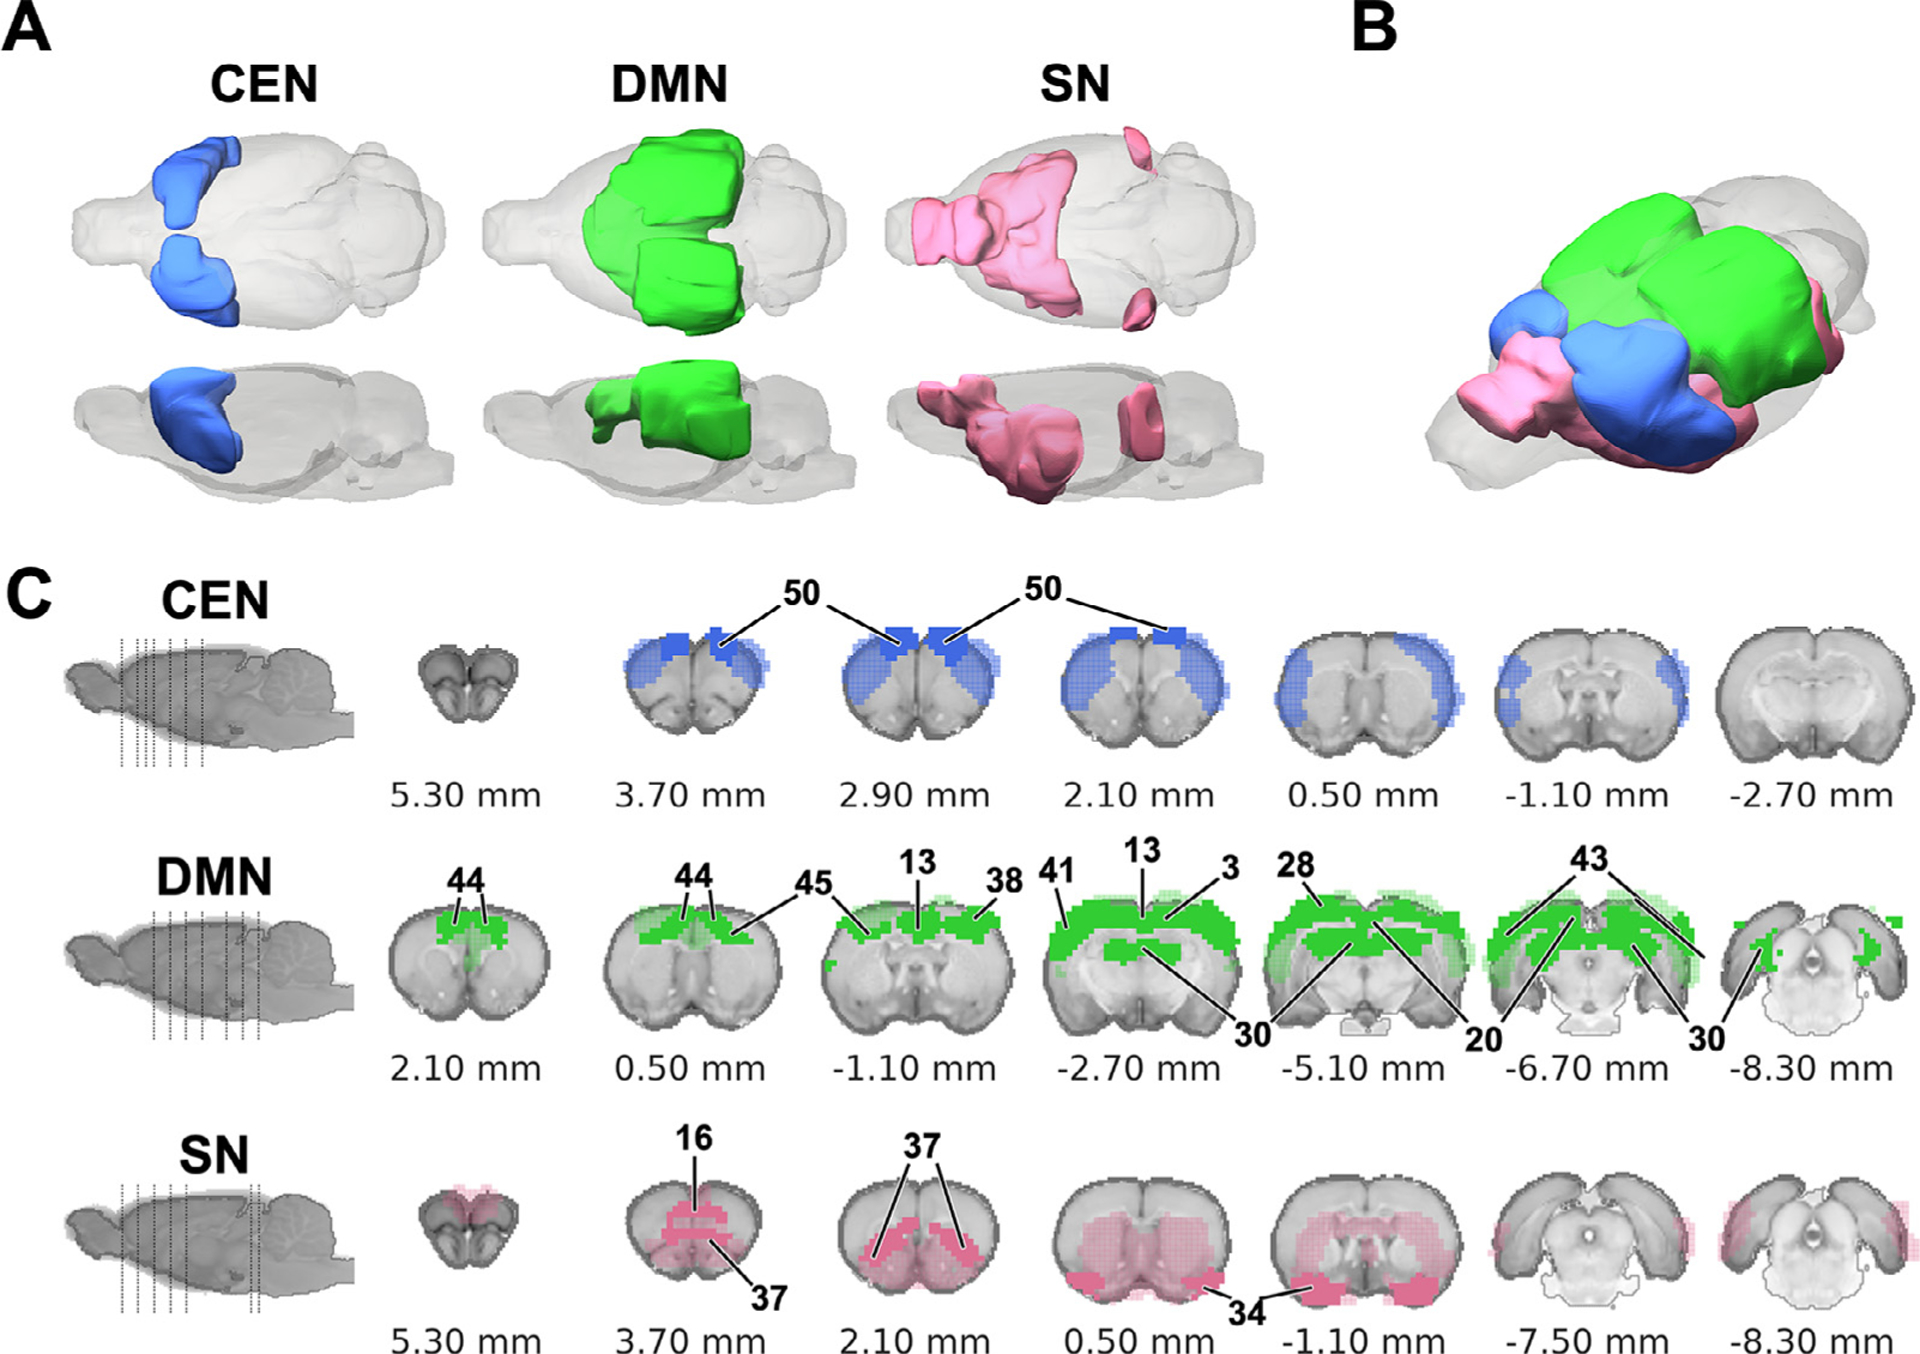
Fig. 14.

Distribution of hub structures among three intrinsic functional networks of the rat brain. (A&B) 3D-rendered CEN, DMN, and SN. (C) Coronal sections showing the contributing regions (light color) and hub structures (solid color) of each network in the Paxinos and Watson’s (7th edition) rat brain coordinates (0 mm indicates bregma location). Numbers pointed to individual brain areas represent ROI ID to indicate hub structure (see Table 1).
