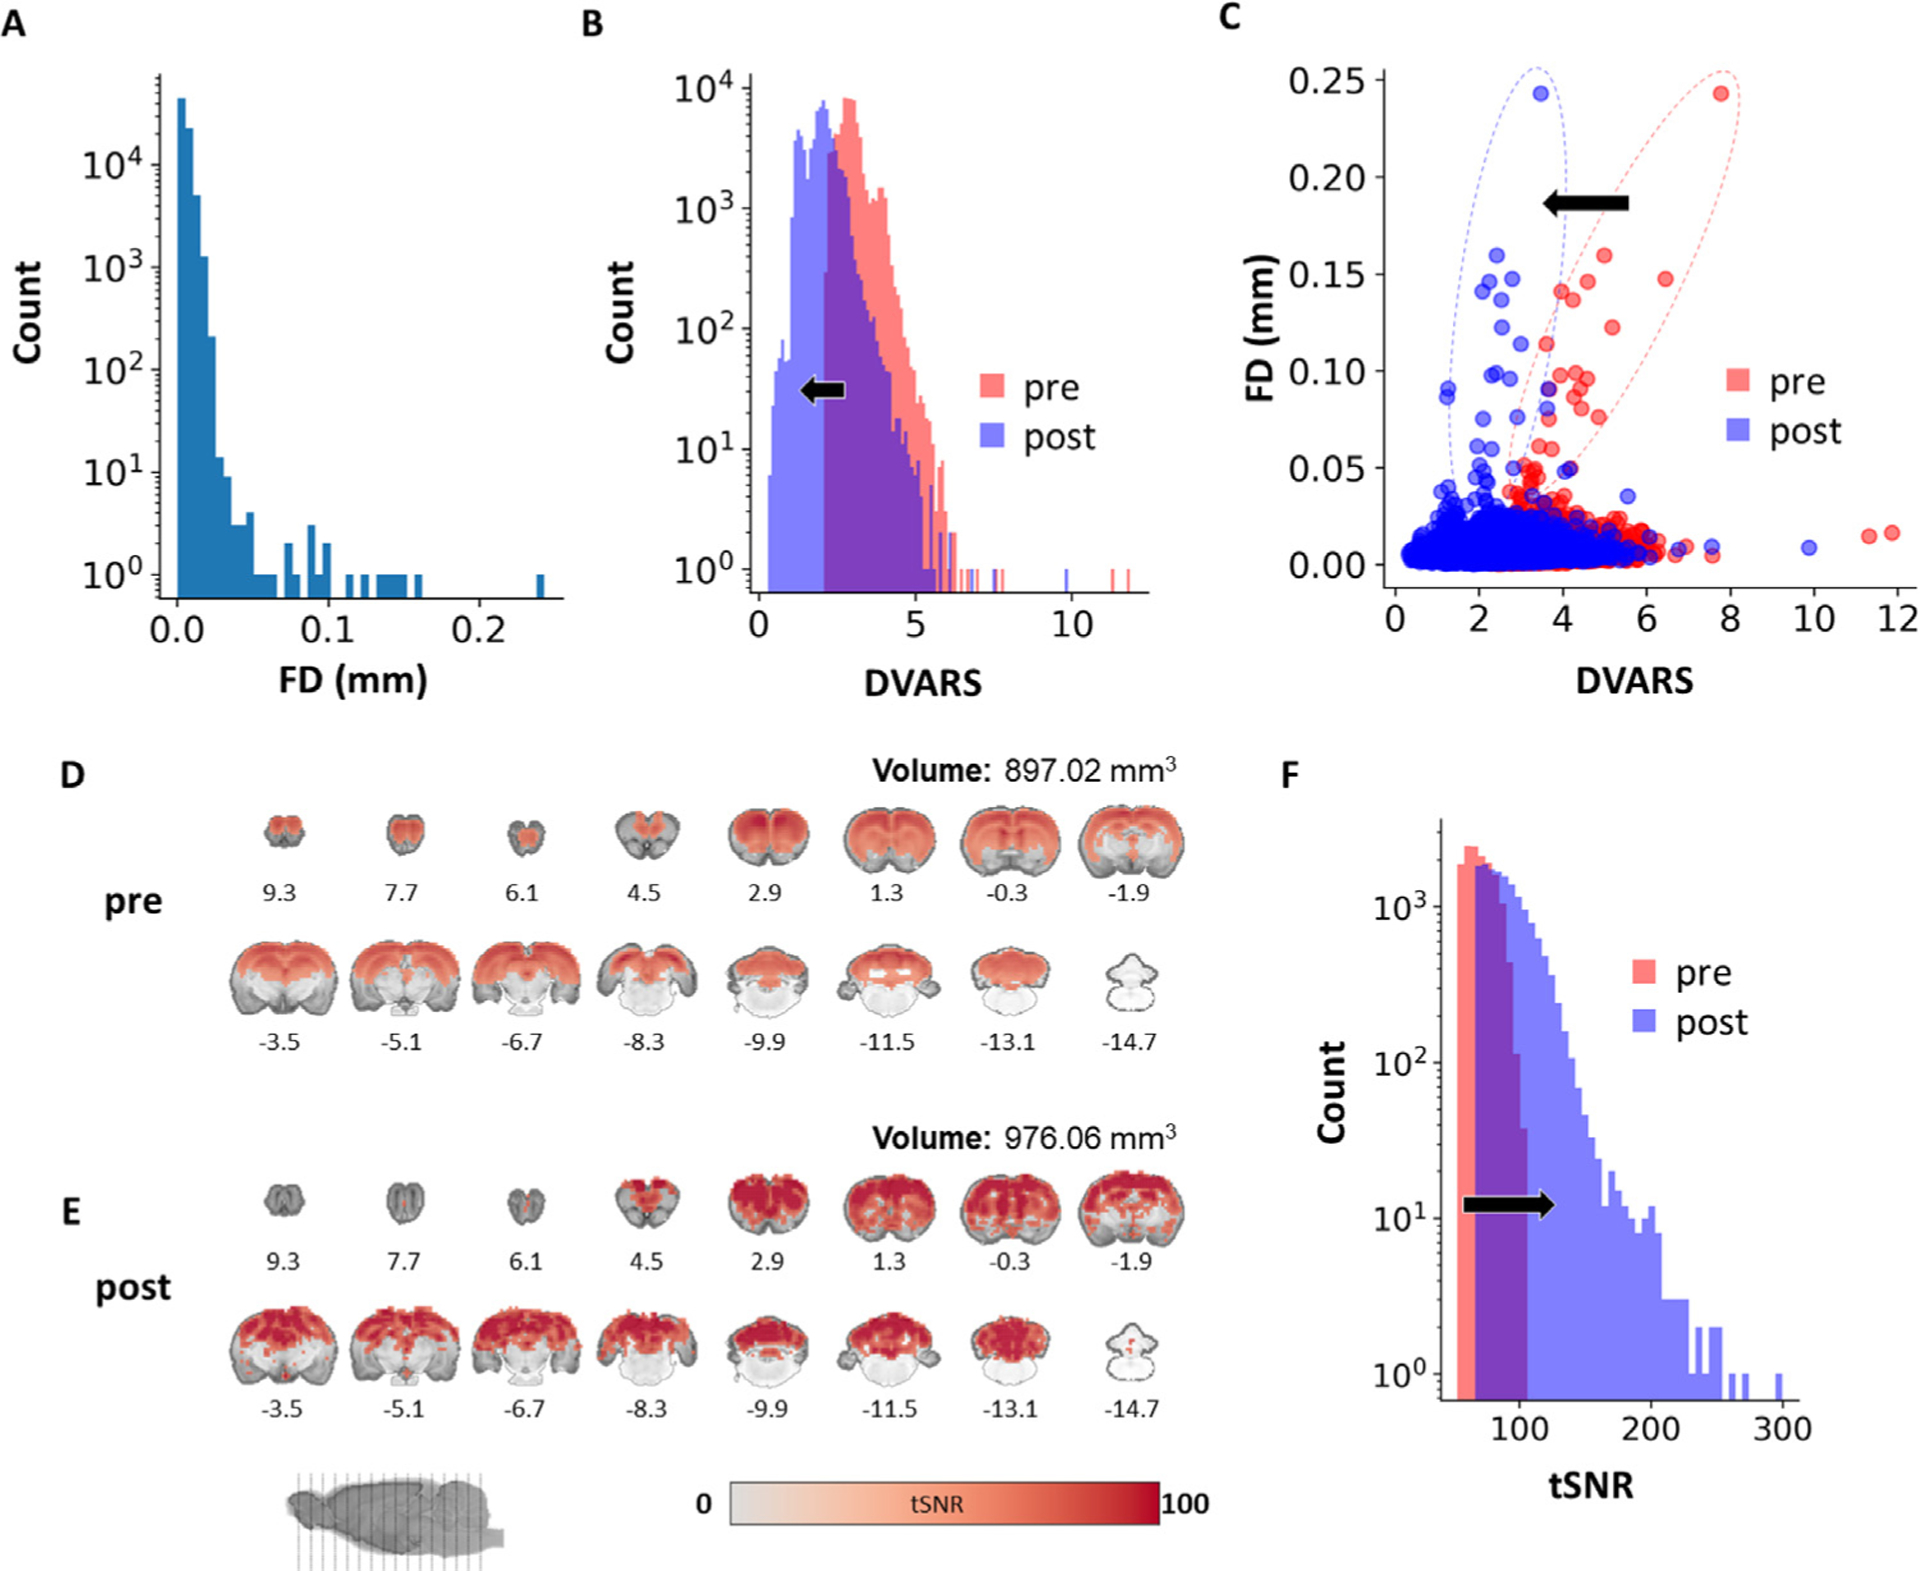
Fig. 5.

Quality profile of whole-brain isotropic EPI data (n = 87). (A) FD histogram of all subject time-courses. (B) DVARS histograms of all subject time-courses. (C) Scatterplot between framewise displacement and DVARS of all subjects. (D) Group-level voxel-wise tSNR map before nuisance removal (p < 0.05). (E) Group-level voxel-wise tSNR map after nuisance removal (p < 0.05), showing an overall increase in tSNR value and brain volume with significant tSNR on the group-level. (F) Histogram of all subject time-courses showing the effect of nuisance removal on tSNR. FD: framewise displacement; DVAR: brain image intensity changes with respect to the previous time point as opposed to the global signal; pre: without nuisance removal; post: with nuisance removal.
