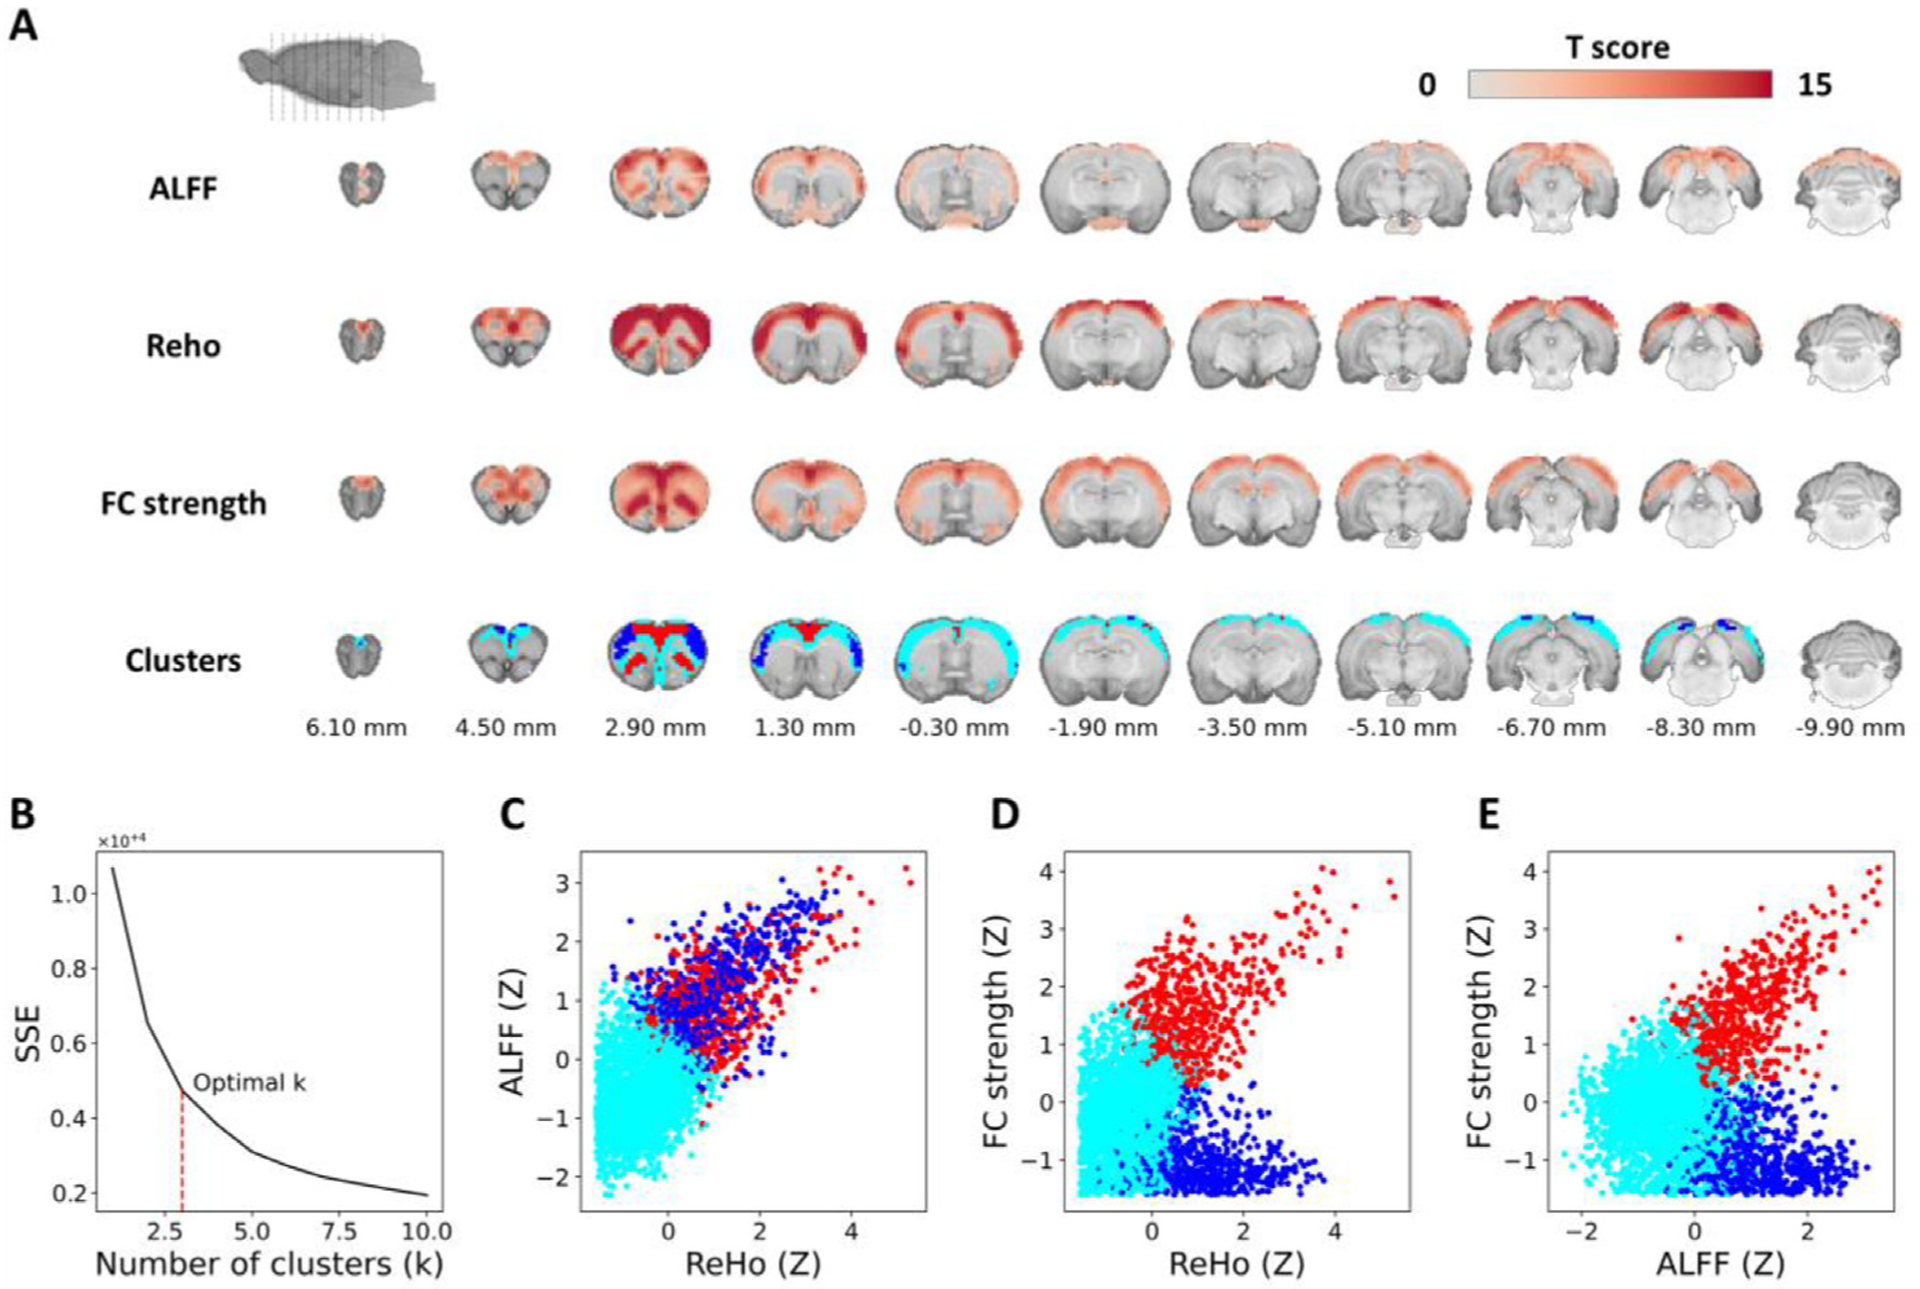
Fig. 6.

Voxel-level resting-state FC metrics. (A) Group-level significance maps of ALFF, ReHo, and FC strength and the three clusters identified using voxel-level k-means clustering in the Paxinos and Watson’s rat brain coordinates (0 mm indicates bregma location). (B) Elbow method to identify an optimal k-value. (C–E) Scatter plots comparing ReHo, ALFF, and FC strength.
