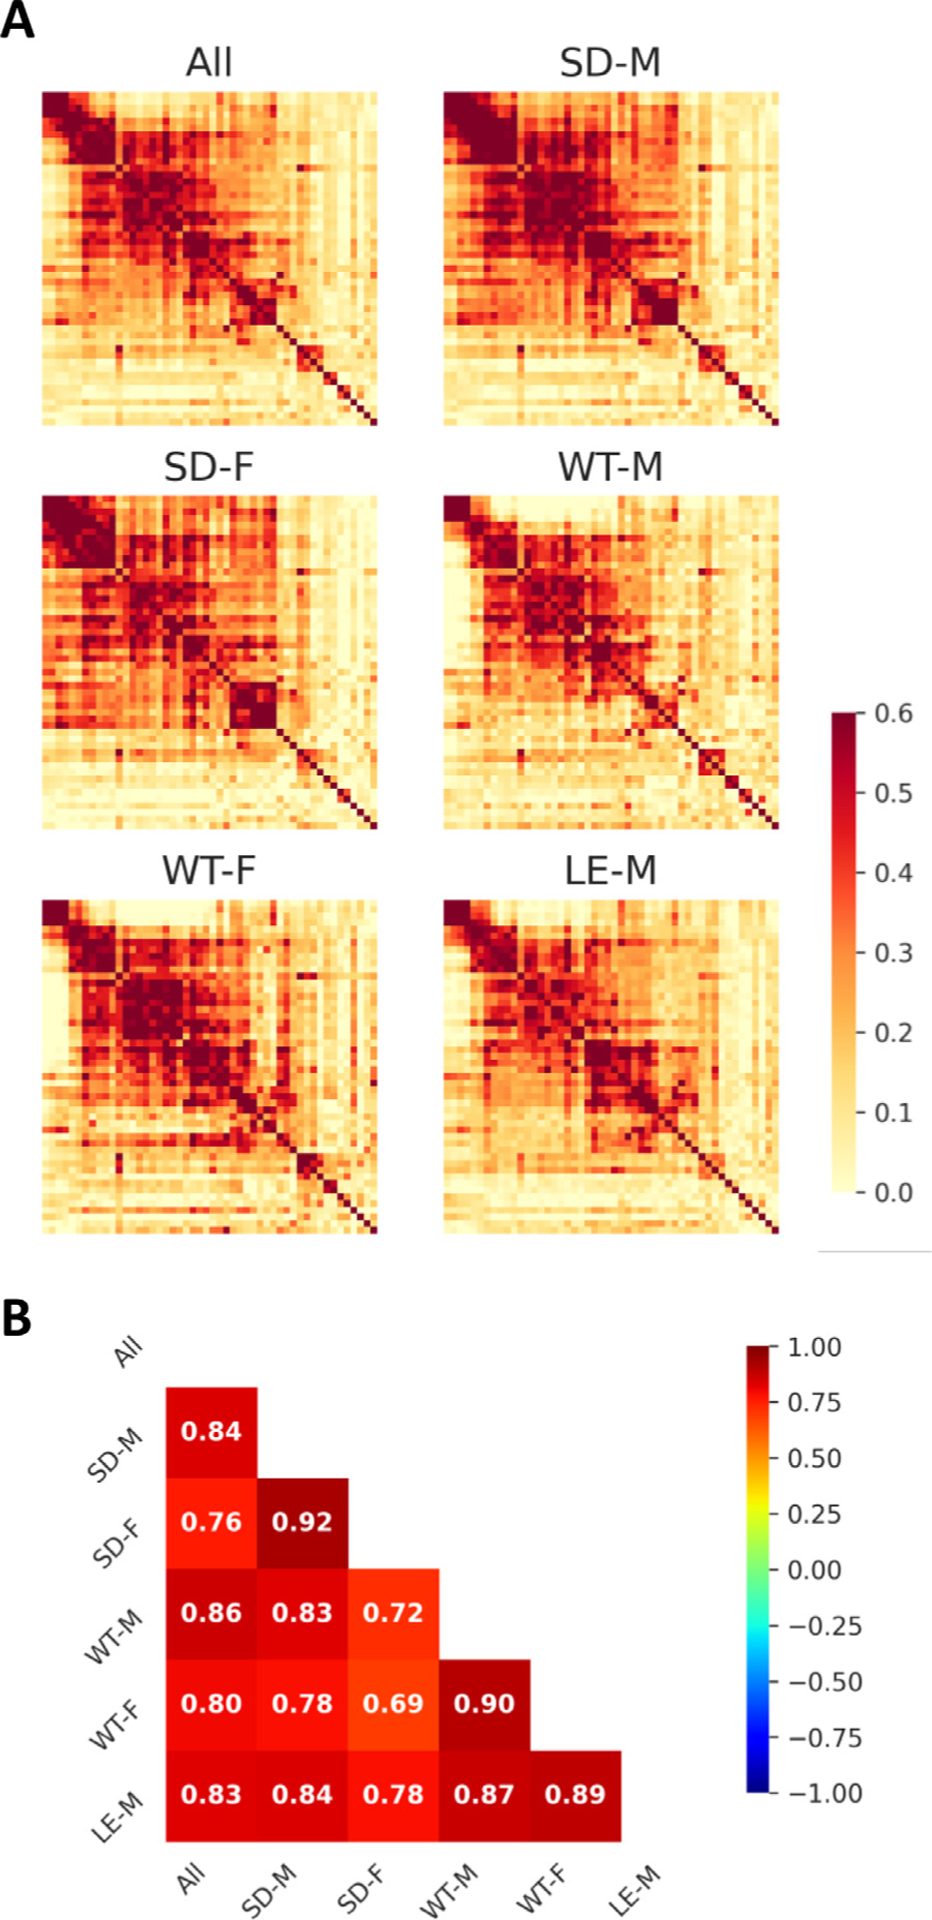
Fig. 9.

Robust group-level FC networks group-level FC networks across rat strains and sexes. (A) Group-level FC matrices of all subjects and specific strain and sex sub-groups. (B) Matrix showing spatial correlation between all subjects and each strain and sex sub-groups. Color bars represent Pearson’s correlation coefficient. SD: Sprague Dawley; WT: Wistar; LE: Long-Evans; M: male; F: female.
