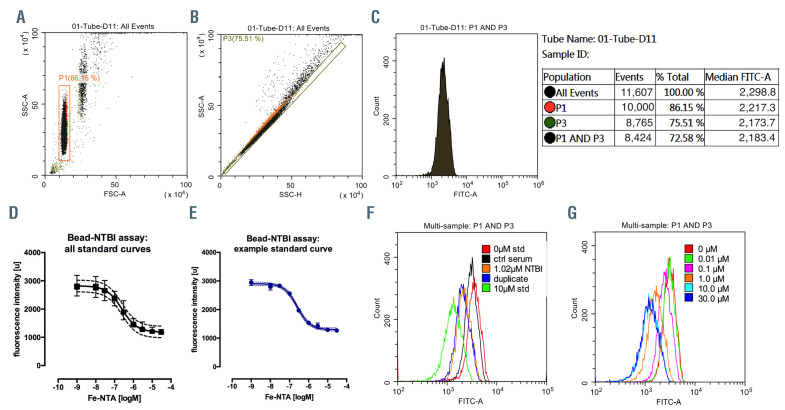
Figure 1.
Bead-non-transferrin-bound iron assay. (A) Side-scatter-area versus forward-scatter-area plot, gate P1 identifies a population of CP-851 beads. (B) Sidescatter- area versus side-scatter-height plot, gate P3 excludes doublets: (C) Histogram of FITC-area from combination of P1 and P3 gates, shown with an example statistics (right), median of the distribution represents the bead fluorescence: (D) All 28 standard curves (each in triplicate) plotted together with mean and standard deviation (SD) shown (n=84), 4-parameter logistic curve fitted r2=0.97. (E) Example standard curve with mean and SD shown (triplicates), logM units were transformed by exponentiation and multiplied by 1.0x10⁶ to obtain results in μmol/L. (F) Overlay histograms of FITC-area, as in C above, for buffer (0 μM ferric nitrilotriacetate [Fe-NTA] standard), control serum, a patient sample in duplicate extrapolated at 1.02 μM non-transferrin-bound iron (NTBI) and 10 μM Fe-NTA standard, see inset. (G) overlay of FITC-area histograms showing a standard curve example. Limit of Blank (95th percentile of eight replicates, LoB) was 0.51nM, Limit of detection (LoB-1.654SD(low standard), LoD) 14.6 nM, Limit of quantitation (LoQ) 30 nM, intra-assay and inter-assay precision coefficients of variation were 1.28% and 4.34% respectively (28 consecutively run assays over 82 days, with triplicate controls).

