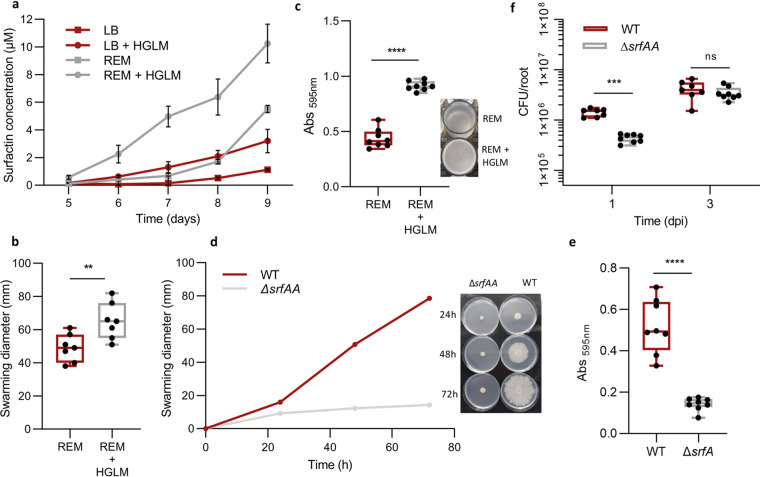
FIG 3.
Ecological importance of an early surfactin accumulation. (a) Evaluation of HGLM and root exudate synergistic effect on early surfactin production. Time course experiment for surfactin quantification was performed in REM (gray curves) and LB medium (red curves) with (circle symbols) or without (square symbols) addition of HGLM. Means ± SE from three biological replicates of one experiment are shown. (b) Swarming potential of B. velezensis GA1 on soft agar plates after addition of HGLM or not. The box plots encompass the 1st and 3rd quartile, the whiskers extend to the minimum and maximum points, and the midline indicates the median (n = 7 biological replicates of one experiment). (c) Evaluation of B. velezensis ability to form pellicles on microwell plates after addition of HGLM or not. The box plots encompass the 1st and 3rd quartile, the whiskers extend to the minimum and maximum points, and the midline indicates the median (n = 8 biological replicates of one experiment). Pellicle formation is illustrated on the right. (d) Comparison of B. velezensis GA1 WT (red) and a ΔsrfAA mutant (gray) for their swarming potential in a time course study. Means ± SE from three biological replicates of one experiment are shown. Time course study is illustrated on the right. (e) Comparison of pellicle formation between GA1 WT strain (red) and a ΔsrfAA mutant (gray). The box plots encompass the 1st and 3rd quartiles, the whiskers extend to the minimum and maximum points, and the midline indicates the median (n = 8 biological replicates of one experiment) ****, P < 0.0001. (f) In vitro comparison of root colonization ability of GA1 (red boxes) and GA1 ΔsrfAA (gray boxes) on tomato plantlets. The box plots encompass the 1st and 3rd quartiles, the whiskers extend to the minimum and maximum points, and the midline indicates the median (n = 7 biological replicates of one experiment) ***, P < 0.001; ns, nonsignificant.

