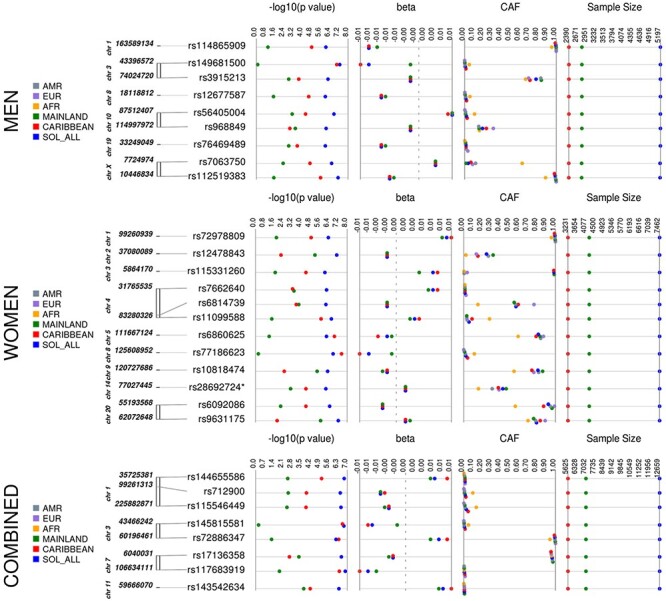
Figure 3 .

HIPadjBMI Synthesis View plot that shows the −log10 P-values, beta (effect estimate), effect/CAF and sample size across analysis samples for all loci that reached suggestive significance in one or more of our discovery strata. This chart also shows the CAF of each of our top loci by background group and by 1000 genomes reference panel. European, EUR; Latin American, AMR; African, AFR.
