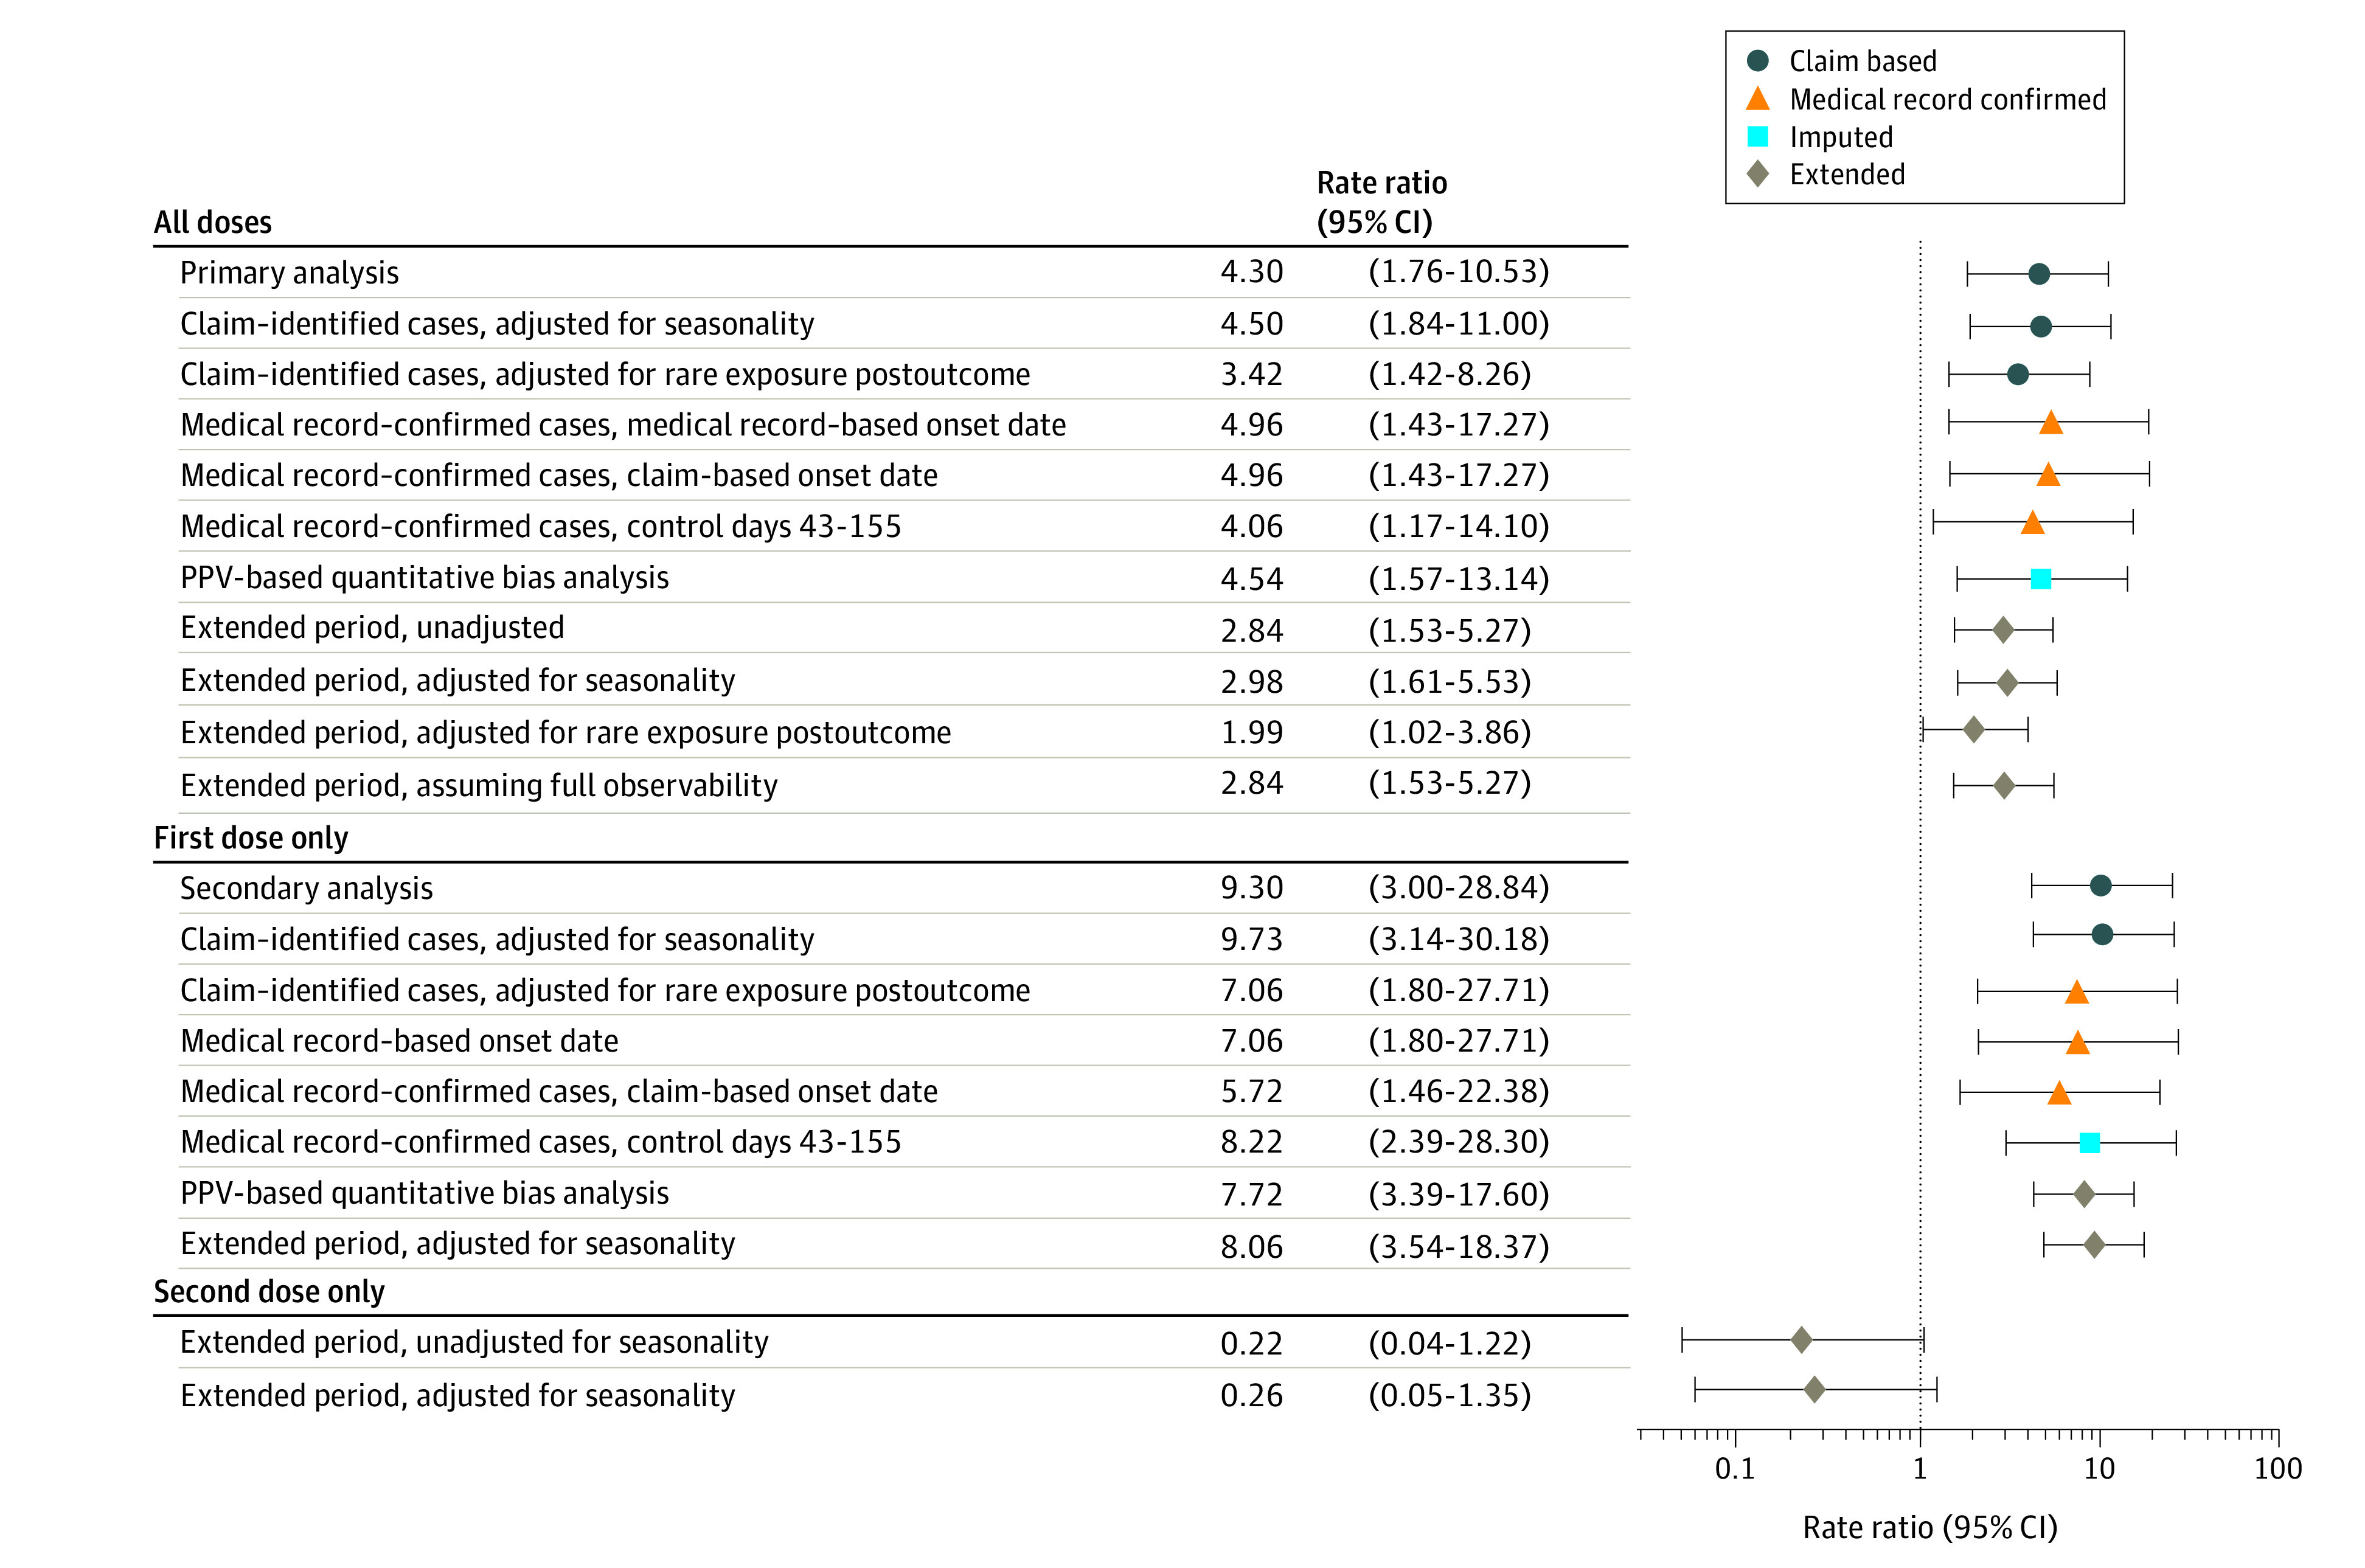
Figure 3. Rate Ratio Forest Plot of GBS Incidence During the Risk Window Compared With the Control Window for SCCS Analyses.

GBS indicates Guillain-Barré Syndrome; PPV, positive predictive value; SCCS, self-controlled case series.

GBS indicates Guillain-Barré Syndrome; PPV, positive predictive value; SCCS, self-controlled case series.