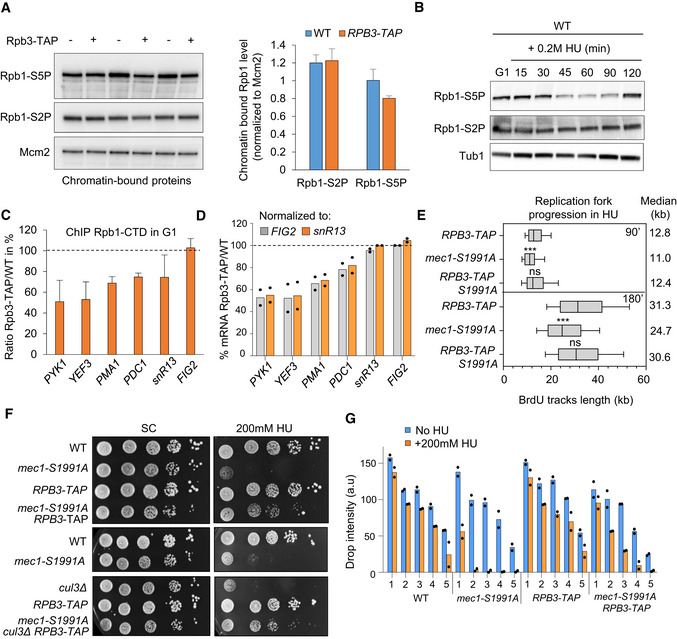
Figure 6. Decreased chromatin‐bound RNAPII levels triggered by RBP3‐TAP rescue mec1‐S1991A defects on HU.

-
APreparations of chromatin‐bound proteins were prepared in triplicate and subjected to SDS–PAGE and immunoblotting with the indicated antibodies in a strain that either does or does not express the Rpb3‐TAP protein from its endogenous locus (Table EV1). Quantification of chromatin‐bound Rpb1‐S2P and Rpb1‐S5P is shown on the right. Mcm2 is used as a loading control. SEM is indicated (n = 3 biological replicates).
-
BG1 synchronized cells were released into S phase with 0.2 M HU, and total protein extracts were collected at the indicated time points (in min); samples were subjected to SDS–PAGE followed by immunoblotting with antibodies against Rpb1‐S2P, Rpb1‐S5P, or tubulin.
-
CEnrichment of the RNAPII subunit Rpb1 on chromatin in G1 synchronized cells was assessed by ChIP‐qPCR at indicated genes. Rpb1 ChIP signal from Rpb3‐TAP expressing cells was normalized to the corresponding untagged strain. The dashed line indicates the amount of Rpb1 in the untagged strain. SEM (n = 3 biological replicates) is indicated. FIG2 is a mating pheromone‐induced gene used as a control to compare inducible gene and constitutively expressed genes (PYK1, YEF3, PMA1, PDC1, and snR13).
-
DmRNA levels measured by RT–qPCR in G1 synchronized cells in the indicated strains. Expression is normalized to either snR13 or FIG2. Data are expressed as a ratio of Rpb3‐TAP/WT in percentage. Individual data points are indicated (n = 2 biological replicates).
-
EAnalysis of replication fork progression (BrdU track lengths) at the single‐molecule level by DNA combing in the indicated strains. Box, whiskers, and median as in Fig 3D. ***P‐value < 10−3; ns = P‐value > 0.05, by Mann–Whitney rank‐sum test using RPB3‐TAP as a reference. RPB3‐TAP 90 min (n = 367) and 180 min (n = 490), mec1‐S1991A 90 min (n = 309) and 180 min (n = 477), mec1‐S1991A RPB3‐TAP 90 min (n = 490) and 180 min (n = 691).
-
F, GA 10‐fold dilution series of cells from exponential SC cultures of the indicated strains were spotted on SC +/− 200 mM of HU. A high level of HU was used to be able to demonstrate robust suppression of the mec1‐S1991A phenotype. (G) Histogram presents quantification of two independent HU sensitivity assays with mean and individual data point values indicated for each yeast dilution.
Source data are available online for this figure.
