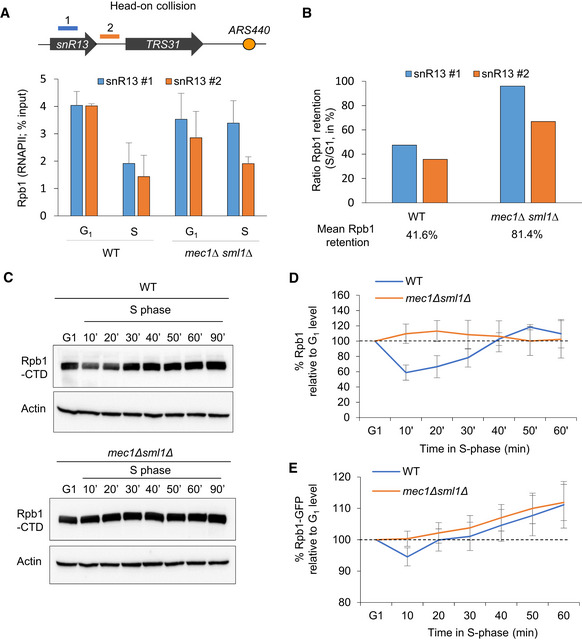
Figure 8. Mec1‐dependent RNAPII degradation occurs during an unchallenged S phase.

-
A, BRNAPII occupancy on chromatin in S phase was assessed by ChIP‐qPCR. (A) The level of Rpb1 was measured at snR13‐TRS31 in both G1 and S phases (70 min at 16°C). Data are expressed as a percentage of input. SEM (n = 3 biological replicates) is indicated. (B) Quantification of the data from (A) depicting the mean retention of Rpb1 in S phase over G1.
-
C, DTotal Rpb1 levels of exponentially growing cells that were synchronized in G1 with α‐factor and released into S phase at 25°C. Actin was used as a loading control. (D) Quantitation of blots in C. Rpb1 levels in S phase is expressed as a percentage of the starting level in G1 (100%, black dashed line). SEM for biological replicates (n = 4 for WT, n = 2 for mec1Δsml1Δ) is indicated.
-
EQuantitation of Rpb1‐GFP fluorescent intensity expressed as percentage over the G1 level. SEM is indicated (n = 106 for WT and n = 102 for mec1Δsml1Δ).
Source data are available online for this figure.
