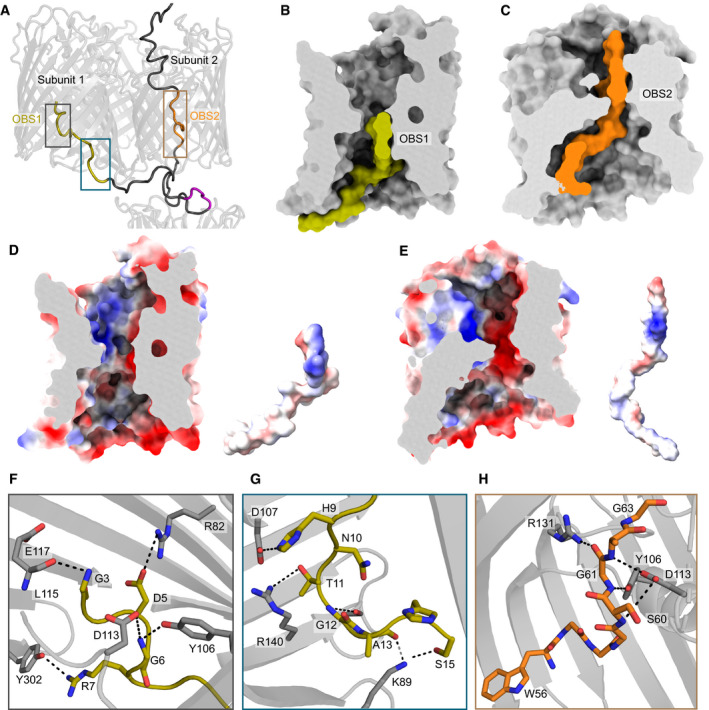
ColE9 residues 3–67 of the IUTD in the partial translocon structure pass through OmpF subunit 2 and then back up into subunit 1. As a result, OBS1 (gold) docks within subunit 1 and OBS2 (orange) within subunit 2. The ColE9 TBE motif (pink) interacts with TolB and is positioned below subunit 2, above which the ColE9 T‐domain is located.
Surface representation of OmpF subunit 1 (grey) and ColE9 residues 3–24 (gold) containing OBS1 sequence. ColE9 OBS1 binds the inner vestibule of OmpF subunit 1 such that it runs along the edge of the vestibule, stopping at the eyelet.
ColE9 residues 45–67 (orange) encompassing OBS2 traverse the pore of OmpF subunit 2 (grey). After passing through the eyelet, OBS2 tracks more centrally in the inner vestibule unlike in panel C where residues 3–24 trail the side of the pore.
OmpF subunit 1 displayed as an electrostatic surface (same cut‐through as in B), revealing a patch of negative charge located on the extracellular side of the eyelet that interacts with OBS1, also shown as an electrostatic surface adjacent to the subunit.
OmpF subunit 2 displayed as an electrostatic surface (same cut‐through as in C), with OBS2 also shown as an electrostatic surface adjacent to the subunit. Projecting out of the page for OBS2 is a positively charged region flanked by negative charges.
A zoom‐in of grey box in panel A highlighting hydrogen bonding network between residues 3–7 of OBS1 (gold sticks) and nearby residues within OmpF subunit 1 (grey sticks).
OBS1 residues 11–17 (gold sticks) also interact with the base of OmpF subunit 1 (grey sticks) in the periplasm. Region is a zoom‐in of blue box in panel A.
OmpF subunit 2 residues (grey sticks) form a hydrogen bond network with the backbone of residues of ColE9 OBS2. Region is a zoom‐in of brown box in panel A. All electrostatic surfaces shown in panels D and E were calculated using the APBS plugin within Pymol.

