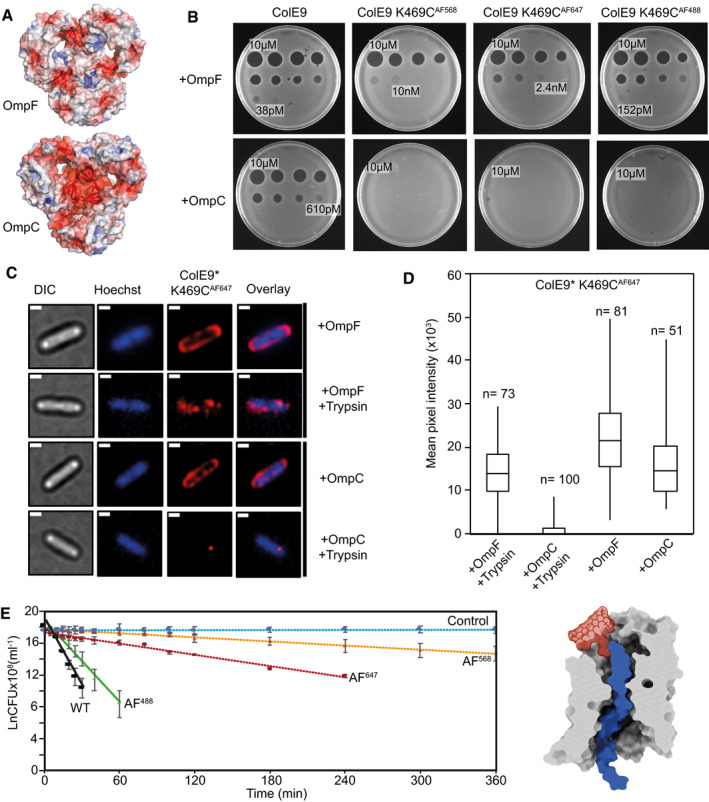
Figure 6. Labelling ColE9 with fluorophores impedes its translocation through the pores of porins.

- Cut‐through molecular surface images showing the distribution of charged residues (acidic, red; basic, blue) at the eyelets of trimeric OmpF (PDB ID 3K19) and OmpC (PDB ID 2J1N). The eyelet of OmpC is significantly more electronegative than that of OmpF. Electrostatic surfaces were calculated using the APBS plugin within Pymol.
- Overnight plate assays comparing the cytotoxic activity of wild‐type ColE9 with ColE9 K469C labelled with AF488, AF568 or AF647 against a lawn of E. coli with either OmpF (JW2203) or OmpC (JW0912) in the outer membrane (shown as +OmpF and +OmpC, respectively). Each plate was spotted with a serial dilution of the colicin (10 µM–2.4 pM, 4‐fold dilution per spot). Wild‐type ColE9 was more active against E. coli cells with OmpF in the outer membrane than OmpC. Labelling ColE9 K469C with fluorophores reduced colicin activity in cells with OmpF in the outer membrane but largely abolished colicin activity in cells with OmpC.
- Widefield fluorescence microscopy images of E. coli JW2203 (+OmpF) and JW0912 (+OmpC) cells labelled with ColE9* K469CAF647 (1.5 µM) and Hoechst stain (20 µM) for 30 min at 37°C with or without trypsin treatment. Each panel shows the same cell in DIC (grey), Hoechst DNA stain (blue) and fluorescence of ColE9* K469CAF647 (red). Overlays of Hoechst and ColE9* K469CAF647 fluorescence are also shown. Data show that following trypsin treatment, significant ColE9* K469CAF647 fluorescence remains associated with ompF‐expressing E. coli, whereas little or no fluorescence remains associated with ompC‐expressing E. coli. Scale bar, 1 µm.
- Box and whisker plots of E. coli JW2203 and E. coli JW0912 cells labelled with ColE9* K469CAF647 with and without trypsin treatment: whiskers represent minimum and maximum mean pixel intensity, box shows 1st and 3rd quartile with the median shown as a line. Microscopy data were collected as in C. The mean pixel intensity of ColE9* K469CAF647 per cell was measured for each cell condition. n, number of cells, typically from 3 or 4 biological replicates. Data show that ColE9* K469CAF647 translocates across the OM through OmpF and that this is impeded when E. coli has OmpC in the outer membrane.
- First‐order cell death kinetics for wild‐type ColE9 or ColE9 K469C labelled with different AF dyes (AF488, AF568, AF647) against E. coli JW2203 with OmpF in the outer membrane. Cultures were incubated with 80 nM toxin at pH 7.5 and 37°C and at various time points the reaction stopped using trypsin at 37°C for 30 min, cells plated out and CFUs recorded. All time courses were conducted in the presence of chloramphenicol (20 µg/ml) to reversibly block cell division, which would otherwise compete with cell killing. Control data shown are for cells with no ColE9 added but where growth was inhibited by the presence of chloramphenicol. Cell‐killing half‐lives, obtained from the fitted first‐order plots shown (error bars represent the standard deviation across two biological replicates), were as follows: wild‐type ColE9, 2.5 min; ColE9 K469CAF488, 4.1 min; ColE9 K469CAF647, 29.6 min; ColE9 K469CAF568, 78.8 min. The data show that the chemical nature of the fluorophore in the C‐terminal DNase domain of ColE9 has a dramatic effect on the cell‐killing kinetics of the colicin. The schematic shown alongside the kinetic data is a surface representation of AF568 (model Generated in coot), the fluorophore with the biggest impact on OmpF‐mediated killing, manually grafted onto the structure of ColE9 OBS2 bound within subunit 2 of OmpF. The slow cell death kinetics of ColE9 K469CAF568 likely reflects the time taken to pass this bulky molecule through the narrow eyelet of the porin.
Source data are available online for this figure.
