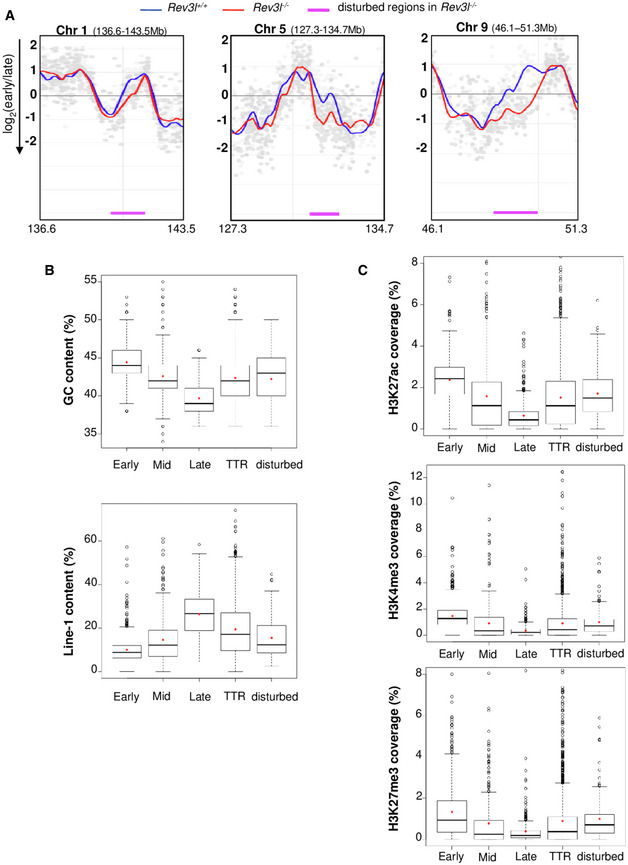
Figure 2. Loss of REV3L disrupts the replication timing in specific genomic loci.

- Cells were pulse‐labeled with BrdU for 1.5 h and sorted by flow cytometry in two fractions, S1 and S2, corresponding to early and late S‐phase fractions, respectively. Neo‐synthesized DNA was immunoprecipitated with BrdU antibodies. Early and late neo‐synthesized DNAs were labeled with Cy3 and Cy5, respectively, and hybridized on microarrays. After processing analysis with the START‐R software, replication‐timing profiles were obtained from two replicates (see Fig EV2A). Shown are the zoomed microarray profiles of the timing of replication on chromosome 1 (136.6–143.5 Mb), chromosome 5 (127.3–134.7 Mb), and chromosome 9 (46.1–51.3 Mb) from Rev3l +/+ and Rev3l −/− MEFs overlaid. Blue lines represent replication timing from Rev3l +/+ MEFs, and red lines represent replication timing from Rev3l −/− MEFs. Genomic regions displaying significant difference between Rev3l +/+ and Rev3l −/− MEFs by START‐R are indicated by a pink line (P < 0.01).
- Analysis of GC and Line‐1 content in early, mid, late, and TTR compared with disturbed replicating regions found in Rev3l −/− MEFs. Bar in boxplot represents the median, and red points represent the mean. The limit of the boxes corresponds to the 0.25–0.75 quartiles with whiskers extending to the maximum value of 1.5 times the interquartile range. Graphs show data from two biological experiments.
- Analysis of the active marks H3K27ac and H3K4me3 and facultative heterochromatin mark H3K27me3 content in early, mid, late, and TTR compared with disturbed replicating regions found in Rev3l −/− MEFs. Bar in boxplot represents the median, and red points represent the mean. The limit of the boxes corresponds to the 0.25–0.75 quartiles with whiskers extending to the maximum value of 1.5 times the interquartile range. Graphs show data from two biological experiments.
