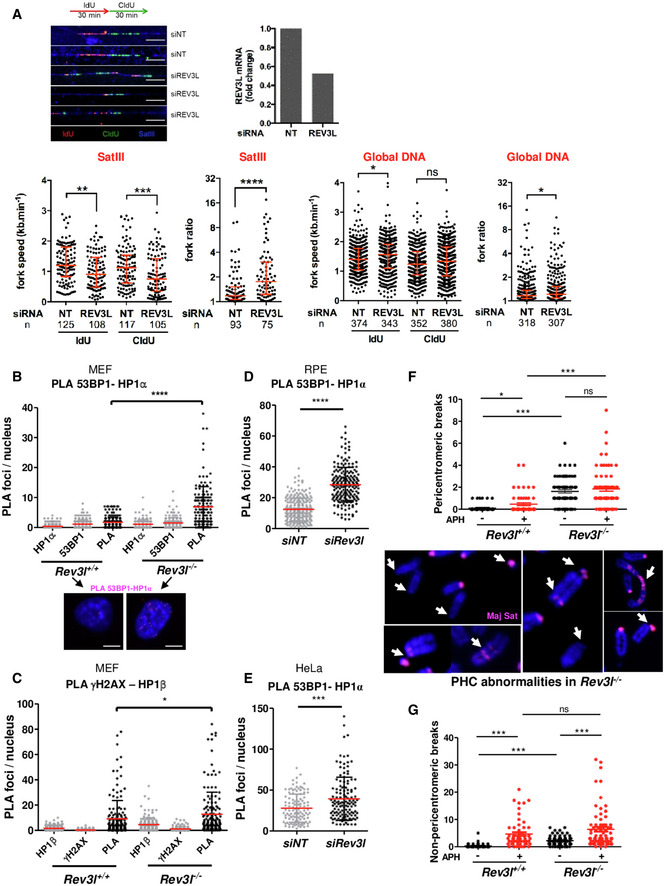
Representative fibers of newly synthesized DNA labeled with IdU (red) for 30 min and CldU (green) for 30 min in HeLa cells transfected with non‐targeting siRNA (siNT) or siRNA against Rev3l. SatIII probe is visualized in blue. Scale bar: 10 μm = 20 kb. Relative Rev3l mRNA level normalized to GAPDH mRNA level is shown (top panel). Distribution of fork speeds (kb/min) and fork ratios (IdU/CldU track length) are shown in dot plots for SatIII and global DNA (bottom panel). The number of fibers analyzed is indicated in (n). Bars represent the median ± interquartile range (Mann–Whitney test. ns: not significant, *P < 0.05; **P < 0.01, ***P < 0.001 and ****P < 0.0001). The presented data are representative of three biological repeats.
Asynchronous Rev3l
+/+ and Rev3l
−/− MEFs were fixed with PFA then subjected to in situ proximity ligation assay (PLA) using 53BP1 and HP1α antibodies; then, PLA foci were counted in both cell lines (more than 150 nuclei for each condition were counted). P‐values were calculated by Mann–Whitney test (****P < 0.0001). Red lines indicate the mean values. Error bars: SEM. Controls with a single antibody are also shown. Experiments were repeated three times. Representative images are shown. Scale bar = 5 μm.
Asynchronous Rev3l
+/+ and Rev3l
−/− MEFs were subjected to PLA as by using γH2AX and HP1β antibodies and processed as in (B). P‐values were calculated by Mann–Whitney test (*P < 0.05). Red lines indicate the mean values. Error bars: SEM. Controls with a single antibody are also shown. Three independent experiments were performed.
RPE cells were transfected with non‐targeting siRNA (siNT) or siRNA against Rev3l; then, 72 h later cells were subjected to PLA by using 53BP1 and HP1α antibodies and processed as in (B). P‐values were calculated by Mann–Whitney test (****P < 0.0001). Red lines indicate the mean values. Error bars: SEM. Three independent experiments were performed.
HeLa cells were transfected with non‐targeting siRNA (siNT) or siRNA against Rev3l; then, 72 h later cells were subjected to PLA by using 53BP1 and HP1α antibodies and processed as in (B). P‐values were calculated by Mann–Whitney test (***P < 0.001). Red lines indicate the mean values. Error bars: SEM. Three independent experiments were performed.
Rev3l
+/+ and Rev3l
−/− MEFs were incubated with or without 0.23 μM aphidicolin for 24 h before metaphase spreading. FISH was performed using major satellite probe to quantify breaks in pericentromeric regions (F). Representative images of chromosomes showing abnormalities (see arrows) in pericentromeric regions from Rev3l
−/− MEFs. Chromosomes were labeled with DAPI, and breaks in non‐pericentromeric regions were quantified (G). Error bars indicate standard error of the mean for three independent experiments. Mann–Whitney test (ns: not significant, *P < 0.05; ***P < 0.001).

