
Figure 3. Diencephalic astrocyte subtypes share gene expression between ependyma and tanycytes.
-
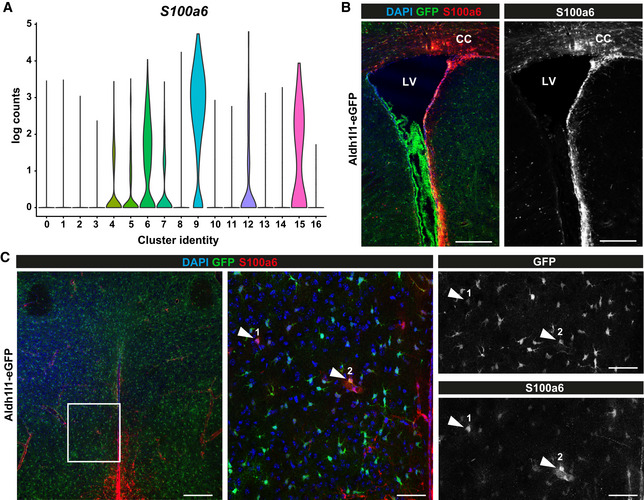
AViolin plot showing scaled log‐normalized read counts of S100a6 expression for each cluster. Colour‐coding corresponds to clusters shown in Fig 1B.
-
B, CIn vivo validation of S100a6 expressing DIE astrocytes in Aldh1l1‐eGFP mouse (3 months) with immunolabelling for S100a6 (B: in the SEZ, C: in the DIE). Inset in left panel of C is depicted in middle and right panels. S100a6/GFP double‐positive cells are indicated by arrowheads. LV: lateral ventricle, CC: corpus callosum. Scale bars: 200 µm (B and left panel C), 50 µm (middle and right panels C).