
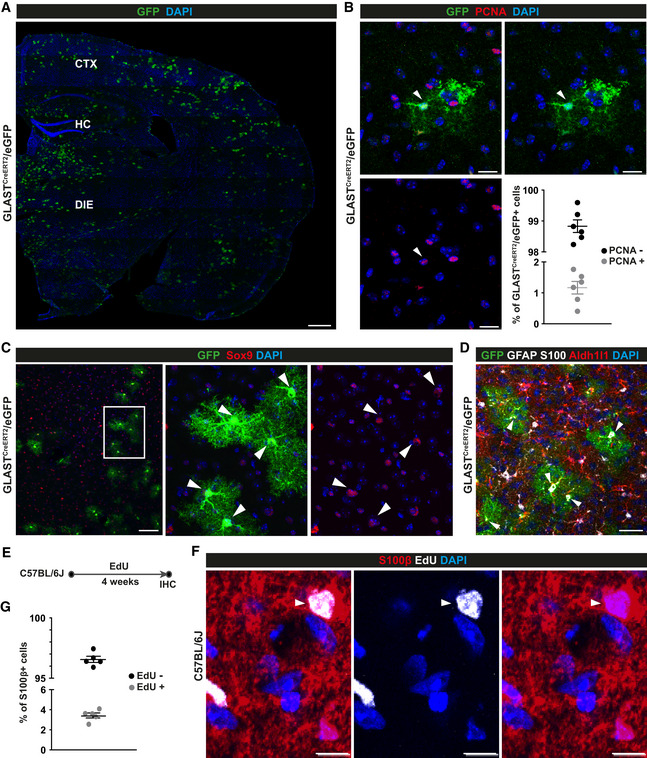
Figure 6. Proliferation of diencephalic astrocytes in the adult mouse brain.
-
A–GMicrographs of maximum intensity projections of forebrain sections from 3‐mo‐old GLASTCreERT2/eGFP mice 21 days after tamoxifen treatment (A–D) and 3‐mo‐old C57BL/6J mice after EdU application for 4 weeks in drinking water (E, F) immunostained as indicated on top of the panels. Double‐positive cells are indicated by arrowheads. CTX: cerebral cortex; DIE: diencephalon; HC: hippocampus. Scale bars: 300 µm (A), 20 µm (B), 75 µm (C), 30 µm (D), 10 µm (F). (B, G) Histograms showing quantifications for B and F (B, n = 6 animals; 5 region of interest (ROI) covering the diencephalon on a total of 3 slides analysed per animal; G, n = 5 animals; 5 ROI covering the diencephalon on a total of 2 slides analysed per animal).
Data information: In B and G data are presented as mean ± SEM. Each data point represents one animal.