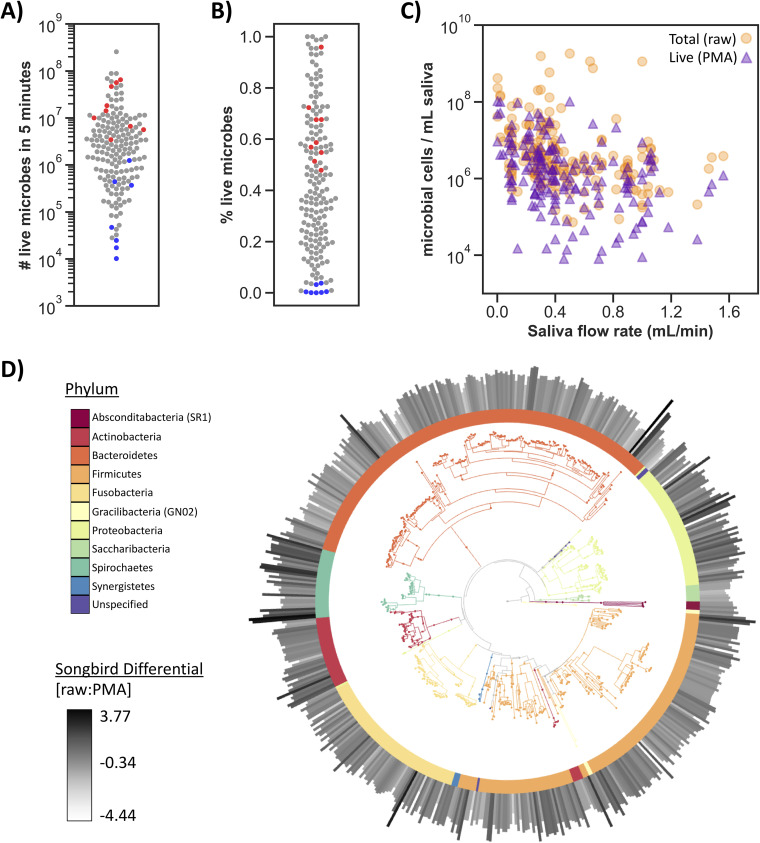
FIG 2.
Microbial load and viability vary widely across healthy participants and are negatively correlated with salivary flow rate. Samples from both the daily dynamics and acute perturbation study are shown combined here (n = 172). (A) Total number of live microbial cells detected in unstimulated saliva collected for 5 minutes determined by PMA treatment and flow cytometry. (B) Percentage of live cells (number of cells after PMA treatment/number of cells detected in raw sample using flow cytometry) in saliva samples. (A, B) Red dots represent saliva samples collected immediately after waking up, and blue dots represent saliva samples collected following alcohol-free mouthwash. (C) Number of microbial cells per ml determined by flow cytometry on the y axis by salivary flow rate in ml per minute on the x axis. Pearson’s correlation coefficient was significant for both raw samples (r = −0.326, P = 1.39e-5) and PMA-treated samples (r = −0.377, P = 3.73e-7) of log-transformed microbial concentration data (log[number of cells per ml]) and salivary flow rate (ml per min). (D) Empress plot showing the SATé-enabled phylogenetic placement (SEPP) insertion tree phylogeny with branches and the inner ring colored by phylum. The outer bar plots represent the Songbird differential for each feature, where the darker and larger the bar the more that feature is associated with raw samples compared with PMA-treated samples.

