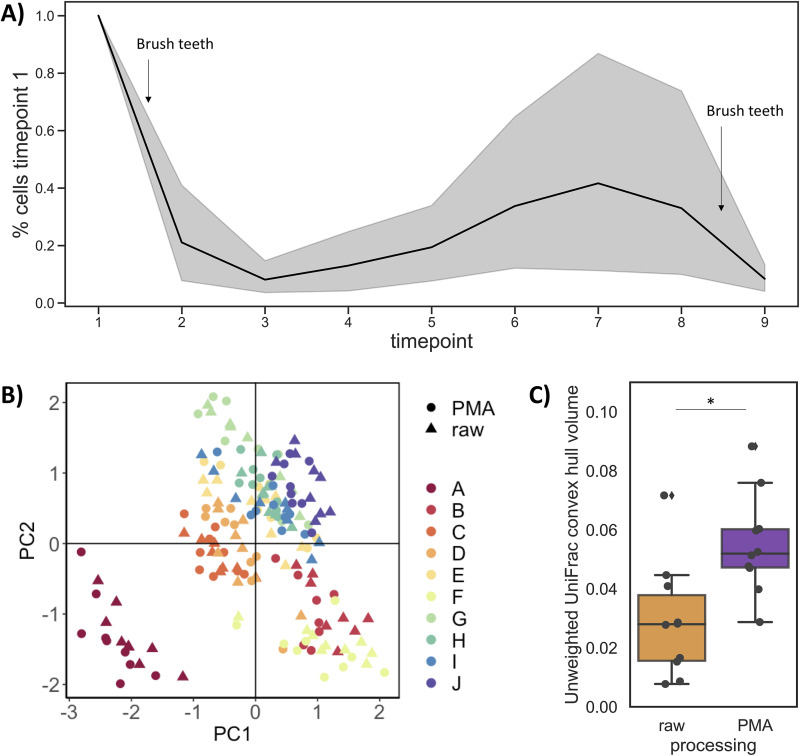
FIG 3.
Daily dynamics of the human saliva microbiome. (A) The percentage of live microbial cells collected in unstimulated saliva (for 5 minutes) normalized to the first time point; samples were collected throughout the course of a day starting from right after waking to before going to bed. (B) Robust Aitchison principal-component analysis (RPCA) reveals clustering by individual (colors) rather than treatment (shape). (C) Convex hull volume per participant on unweighted Unifrac distance shows greater microbial variation when dead cell signal was removed (PMA-processed samples). Two-sided related t test, P = 0.03.

