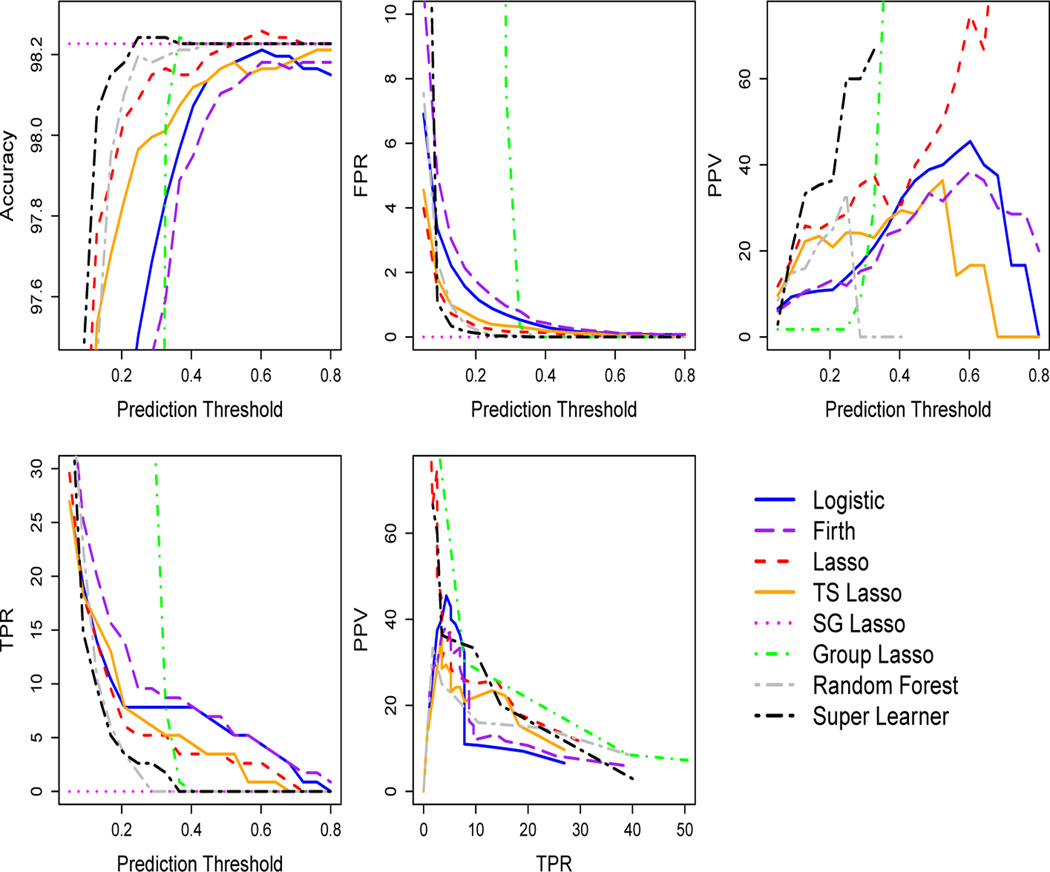
Figure 2.
Data Analysis: Cross-Validated Algorithm Performance by Prediction Threshold and Precision-Recall Plot for 30-Day Mortality in Isolated AVR Cohort. Prediction threshold chosen to maximize accuracy. Plots display the mean over 5-folds at each threshold value. For algorithms with TPR equal to zero, PPV is undefined and not plotted. In this isolated AVR cohort, the naive prediction rule accuracy is the same as the sparse group (SG) lasso. TS is an abbreviation for treatment-specific.

