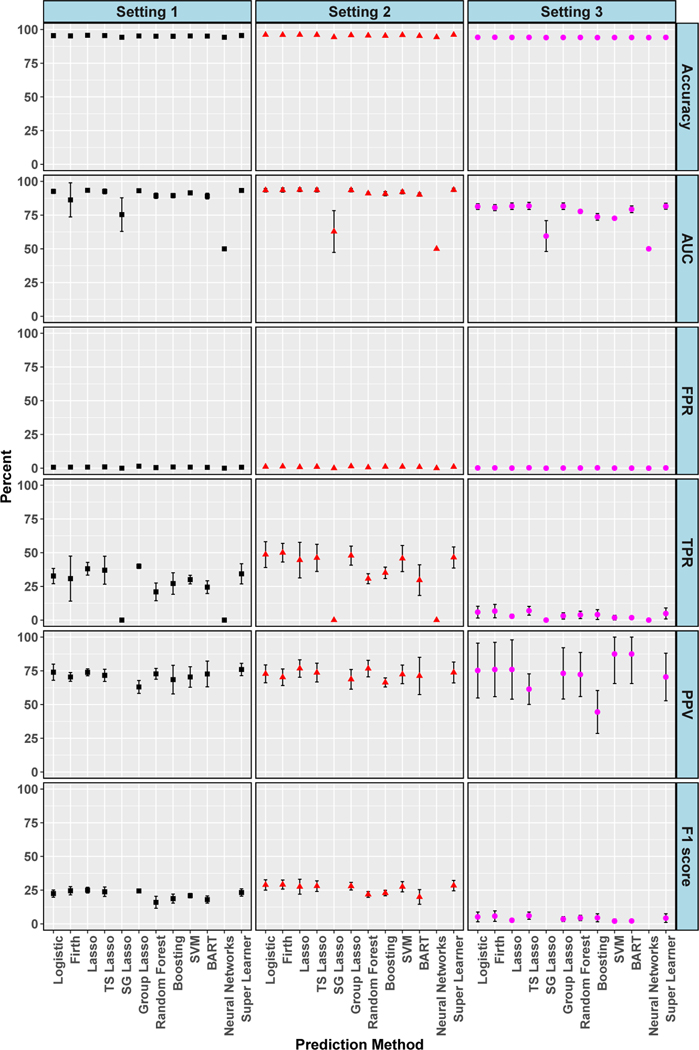
Figure 5.
Simulation: Cross-Validated Algorithm Performance for 1-Year Mortality in Isolated AVR Cohort. For algorithms with zero predicted positive values, PPV is undefined and not plotted, and therefore F1 score is also undefined and not plotted. 95% confidence intervals for estimates with standard errors less than 1% are not shown. True conditional risk estimate based on AUC loss is 94% for settings 1 and 2 and 95% for setting 3. TS is an abbreviation for treatment-specific and SG for sparse group.

