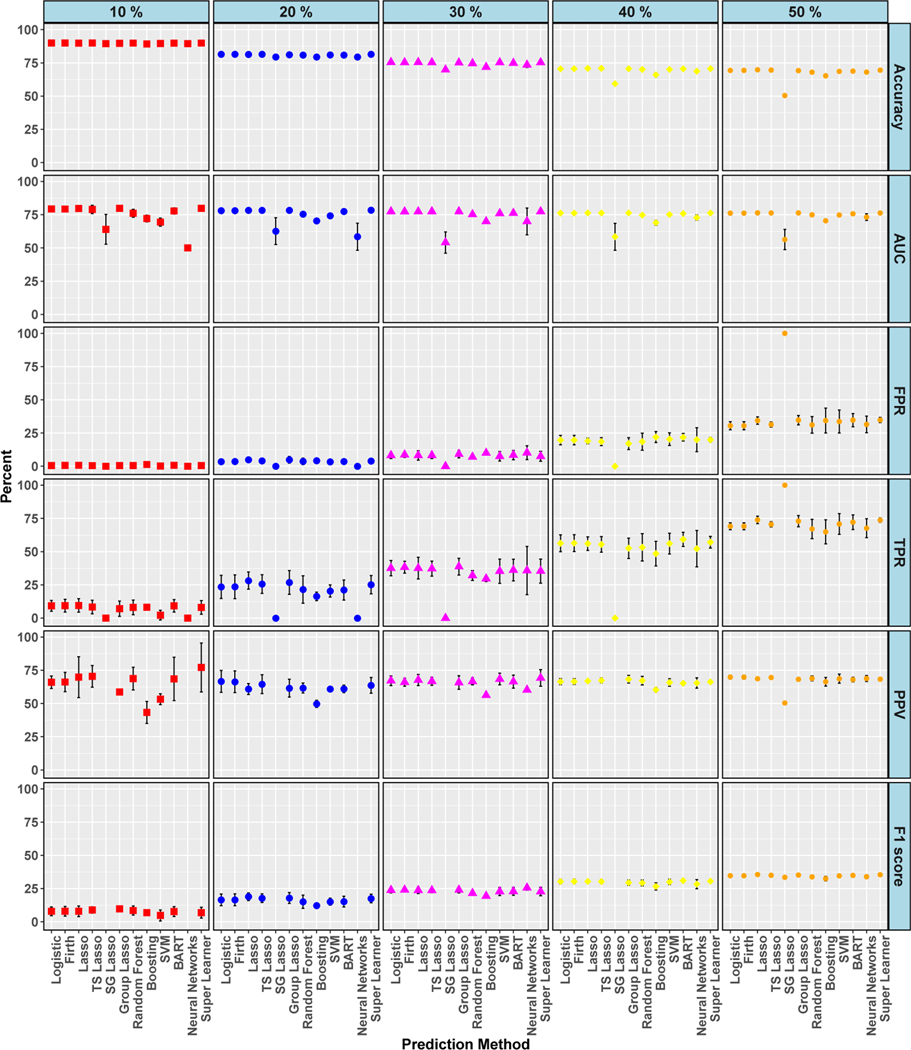
Figure 6.
Simulation: Cross-Validated Algorithm Performance for Varied Class Balance in Simulation Setting 3. For algorithms with zero predicted positive values, PPV is undefined and not plotted, and therefore F1 score is also undefined and not plotted. 95% confidence intervals for estimates with standard errors less than 1% are not shown. True conditional risk estimate based on AUC loss is 94% (for 10% event rate), 92% (for 20%, 30%, and 50% event rates), and 91% (for 40% event rate). TS is an abbreviation for treatment-specific and SG is for sparse group.

