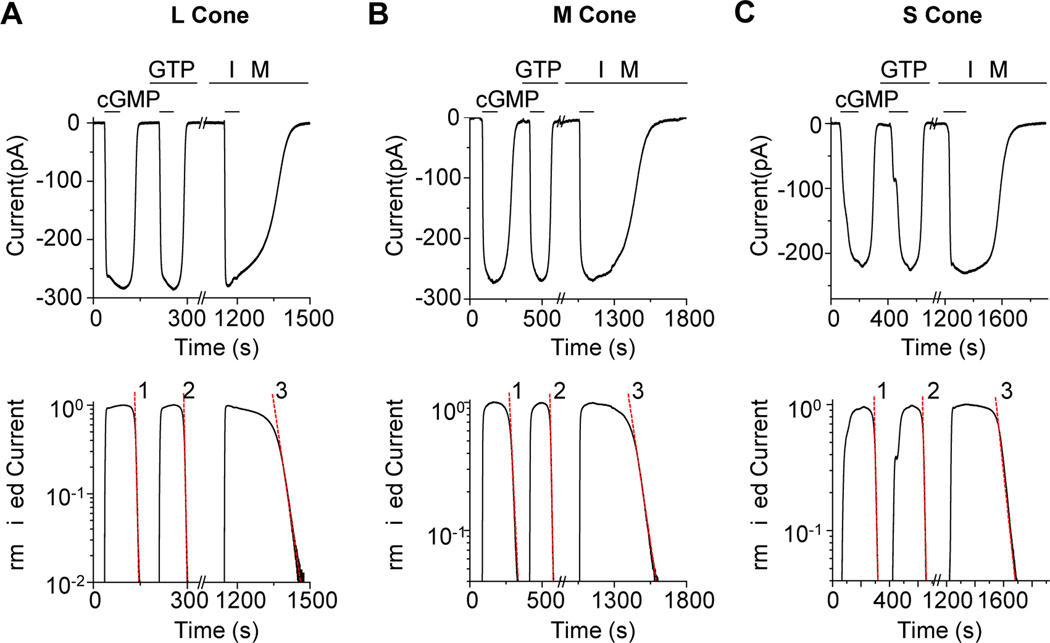
Figure 2. Quantification of dark PDE activity.
(A-C) Top, membrane current from a truncated L cone (A), M cone (B), and S cone (C) induced by 3-mM cGMP. In L and M cones, the current decay after bath cGMP removal was faster in the presence of 15-μM GTP, while in S cones, there was no detectable GTP-dependent PDE activity. In each cone subtype, the current decay was dramatically slowed down by addition of 1-mM IBMX, indicating substantial intrinsic PDE activity. (A-C) Bottom, semi-log plot showing single-exponential decline of membrane current (shown in Top panel) following each solution change. The semi-log slope values (dashed red line) of the exponential declines were used to calculate the intrinsic dark PDE activity, the spontaneous GTP-dependent PDE activity, and the cGMP diffusion coefficient for each cone subtype (see Text and Table S1).

