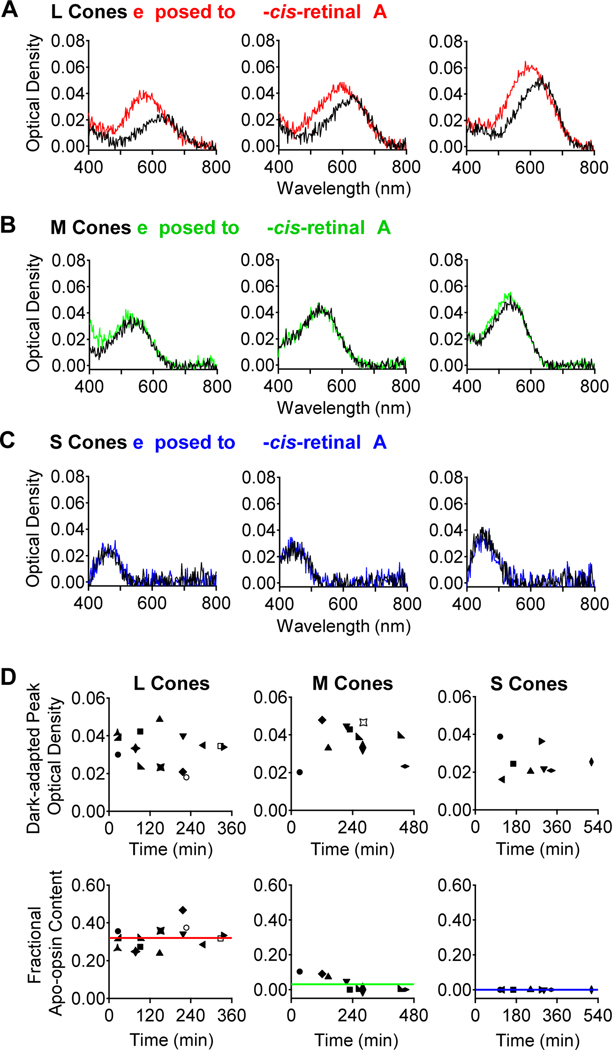
Figure 4. Apo-opsin content in dark-adapted goldfish cones.
(A) Optical-density measurements with microspectrophotometry on three individual dark-adapted L cones before (black) and after (red) exposure to 11-cis-retinal (A1 chromophore). (B, C) Corresponding experiments on three dark-adapted M and S cones, respectively. The spectra represent absorbance in T-polarization for the L and M cones, and in T minus L polarization for the S cones. (D) Collected data. Top, Peak optical density and Bottom, calculated fractional apo-opsin content of dark-adapted L, M and S cones (see STAR★METHODS). The mean apo-opsin content across all cells is indicated by solid red, green, or blue line for L, M, and S cones, respectively.

