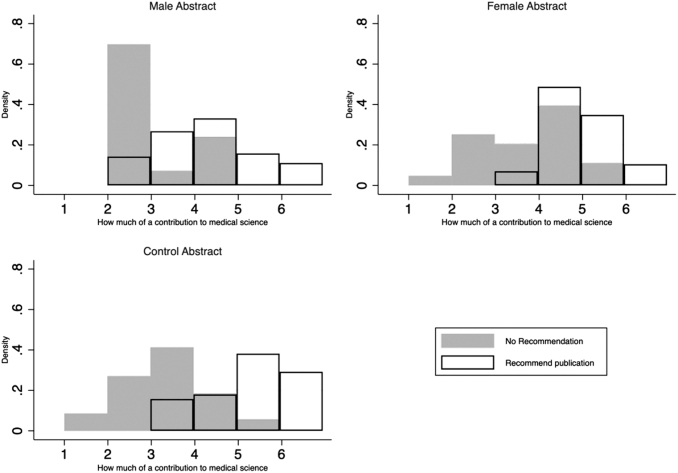
FIG. 3.
Histograms of “contribution to medical science” (1 = none to 7 = major) by publication recommendation and abstract conditions. Gray histogram for publication not recommended and white histogram for publication recommended by the three abstract conditions (male, female, and control). The y-axis refers to the proportion of recommendations to publish for each assessment of contribution to medical science so that they sum to 1.0. This makes it possible to use the same vertical scale. So, for example, a y-scale of 0.5 means that 50% of overall responses occurred at a certain range of x-axis (e.g., 1 to ∼1.99, 2 to ∼2.99, 3 to ∼3.99, and so on). Each histogram shows the positive relationship between “contribution to medical science” and “recommendation for publication,” which is relatively consistent across the three abstract conditions.

