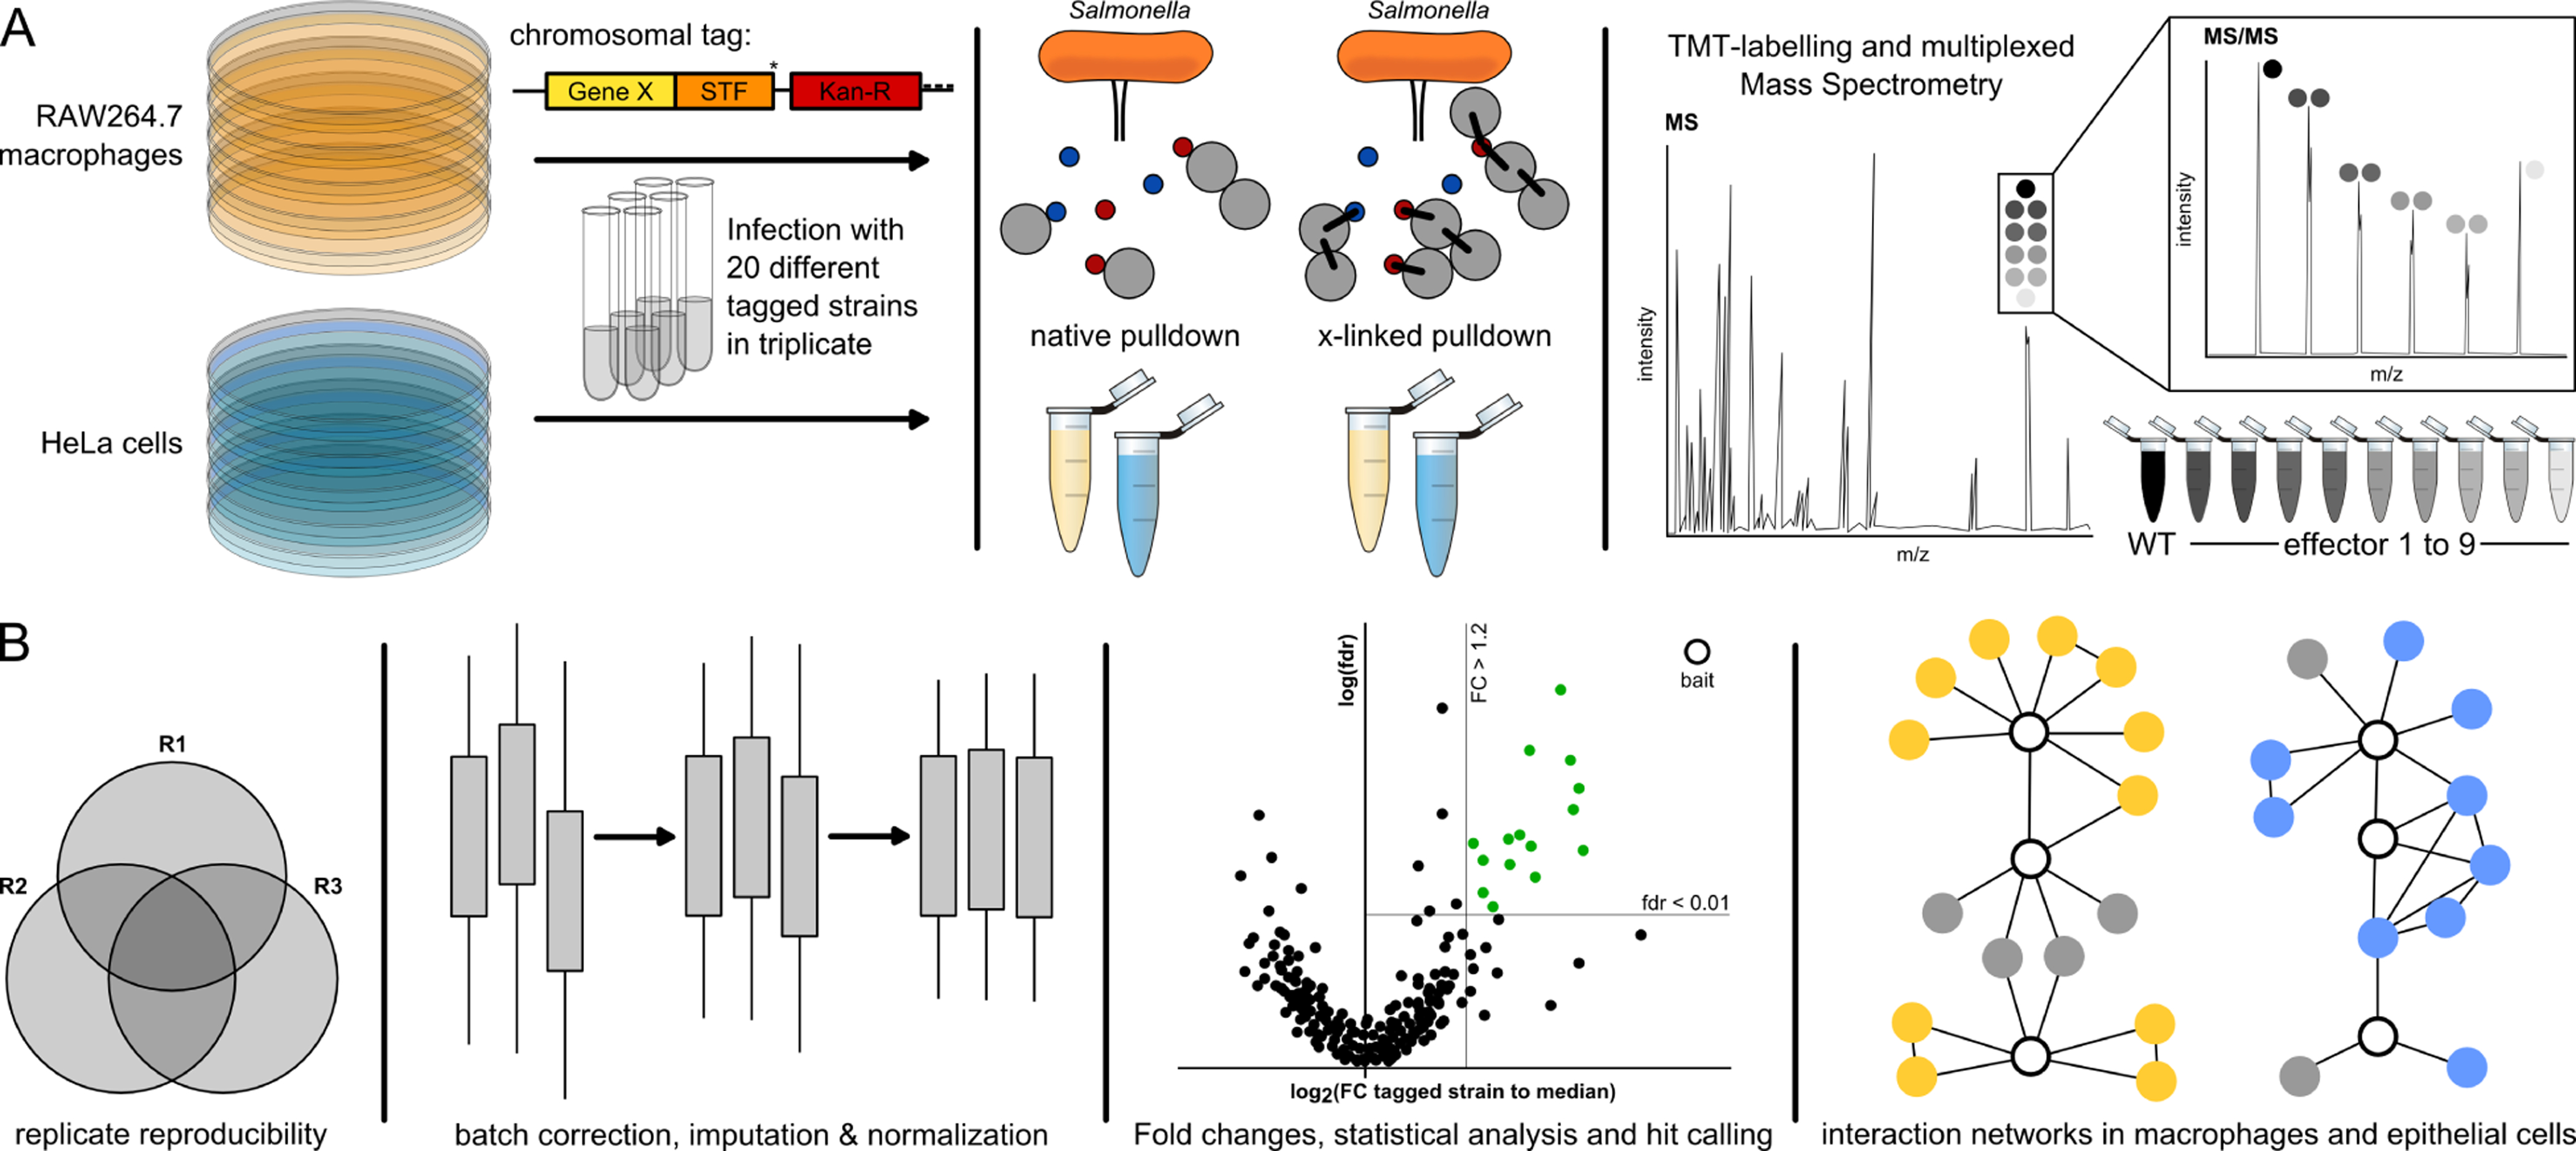
Figure 1. AP-QMS pipeline for mapping effector-host PPIs during Salmonella infection.

(A) STm strains carrying C-terminally tagged effectors with STF (FLAG(2x)-TEV-STREP(3x)) were used to infect HeLa and RAW264.7 cells at a MOI ~100. Samples were either treated with DSP crosslinker or directly lysed for native anti-FLAG pulldowns. Eluates from the pulldowns were combined in a TMT-10plex labelling run and measured by LC-MS/MS. Elutions from nine different STF-tagged effectors and one untagged wildtype background control were combined.
(B) Only proteins quantified with at least two unique peptides and identified in at least two biological replicates were used for analysis. A protein was a ‘hit’ when the false discovery rate (fdr) was < 1% and exhibited a fold increase of at least 20%. We further refined this list by loosening the fdr requirement to < 5% if a PPI passed the fold change (FC) requirement in both native and crosslinked conditions. Subsequently, only the strongest 20 PPIs per effector with respect to FC or fdr, as well as PPIs detected in both the native and crosslinked pulldowns, were kept for the final hit list. All analyzed data and hits are listed in Table S2. Volcano plots of all pulldowns can be found in Mendeley Data. PPI networks were built from hits and known host functional interactions.
