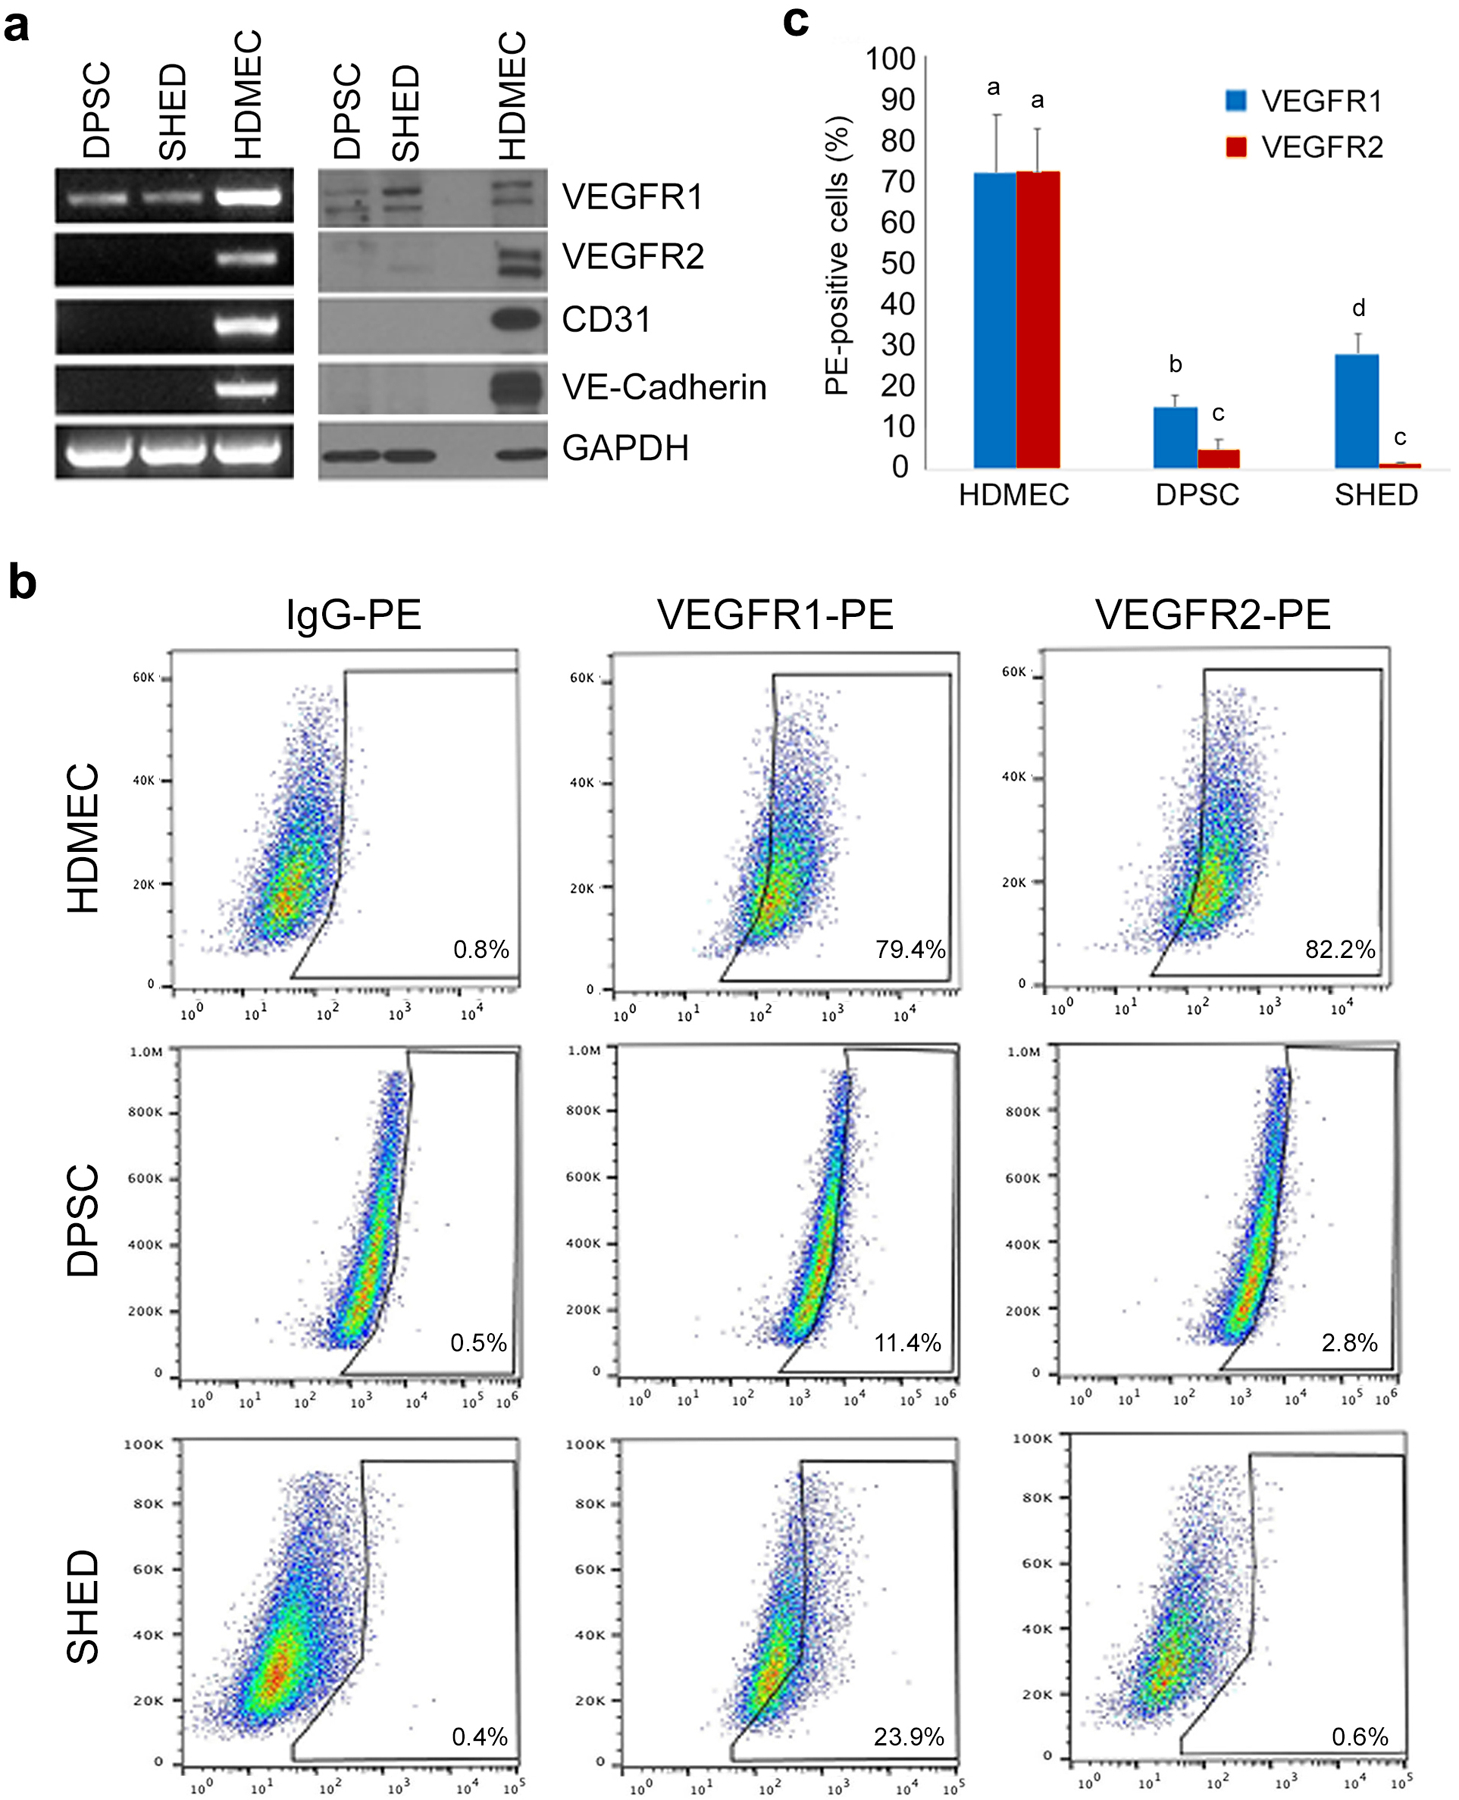
Fig. 1. Baseline expression of VEGFR1 and VEGFR2 in dental pulp stem cells.

(a) RT-PCR and Western Blot analyses of VEGFR1, VEGFR2, CD-31, and VE-cadherin expression in DPSC and SHED cultured in alpha-MEM + 20% FBS. (b) Flow cytometric analyses of VEGFR1 and VEGFR2 expression in SHED, DPSC and human dermal microvascular endothelial cells (HDMEC). Cells are presented in a dot plot of Side Scatter Area (SSC-A) gating against PE fluorescence. Cells were analyzed using anti-VEGFR1 and anti-VEGFR2 PE-conjugated antibodies, and an isotype-matched IgG as control to set the gating. (c) Graph depicting the percentage of VEGFR1 and VEGFR2-positive cells in SHED, DPSC and HDMEC. Different low case letters indicate statistical significance at p<0.05.
