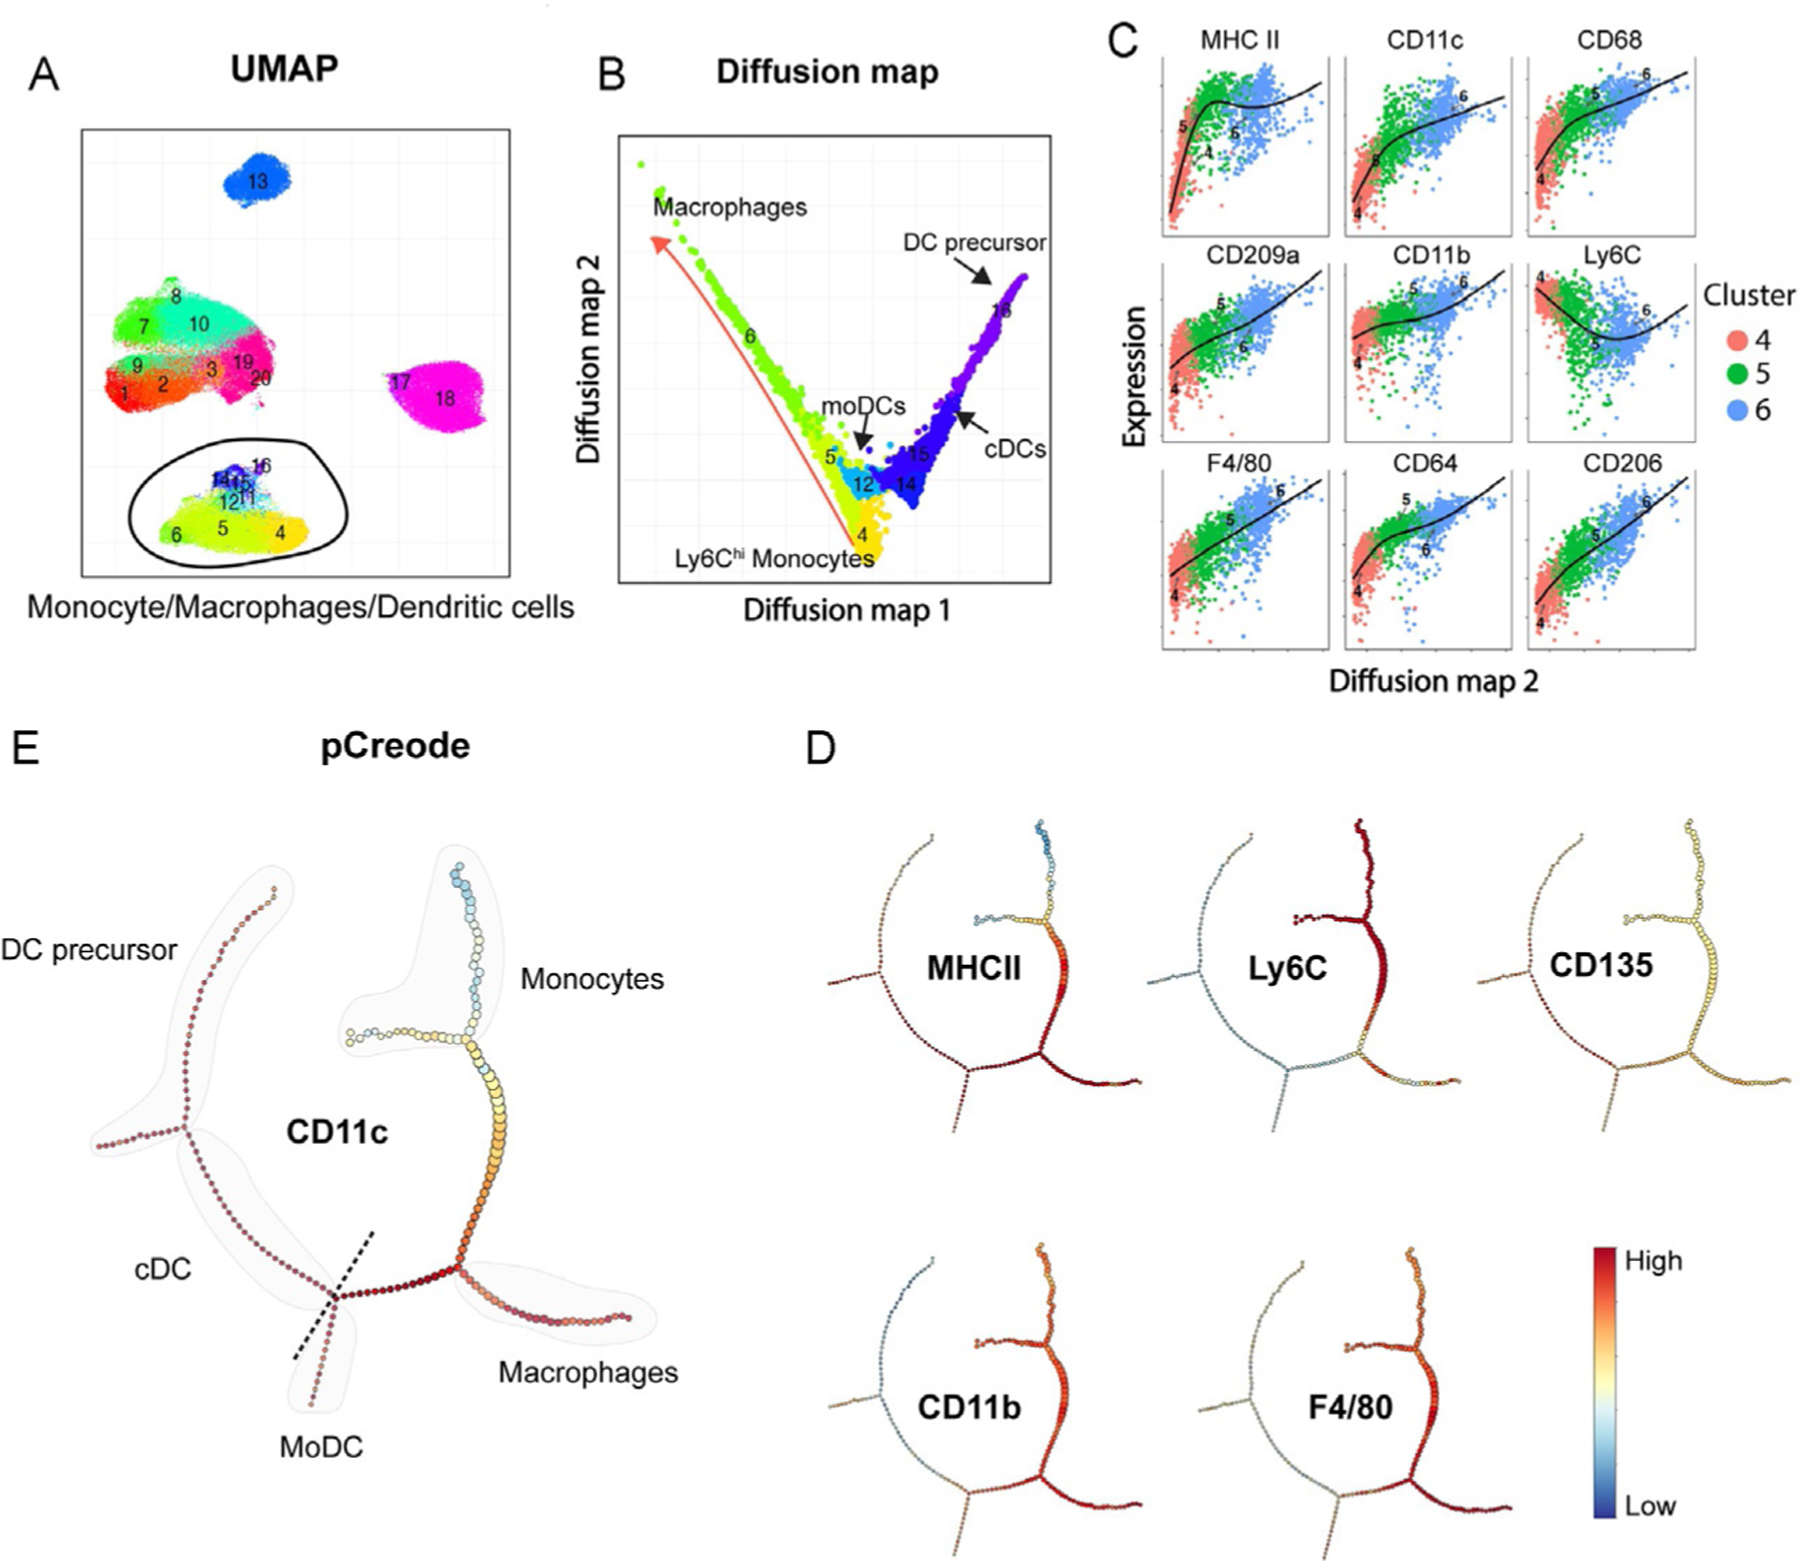
Fig. 6.

Trajectory analysis of monocytes, macrophages, and dendritic cells in the TME. (A) UMAP visualization from Fig. 5C showing clusters selected for diffusion map analysis. (B) 2D representation of the diffusion map analysis with an overlay of FlowSOM clusters. (C) Expression level of markers across clusters 4-5-6. (D) pCreode analysis from the same clusters from (B) (plot ranked 0 from n = 10 runs). (E) Overlay of markers in pCreode from (D).
