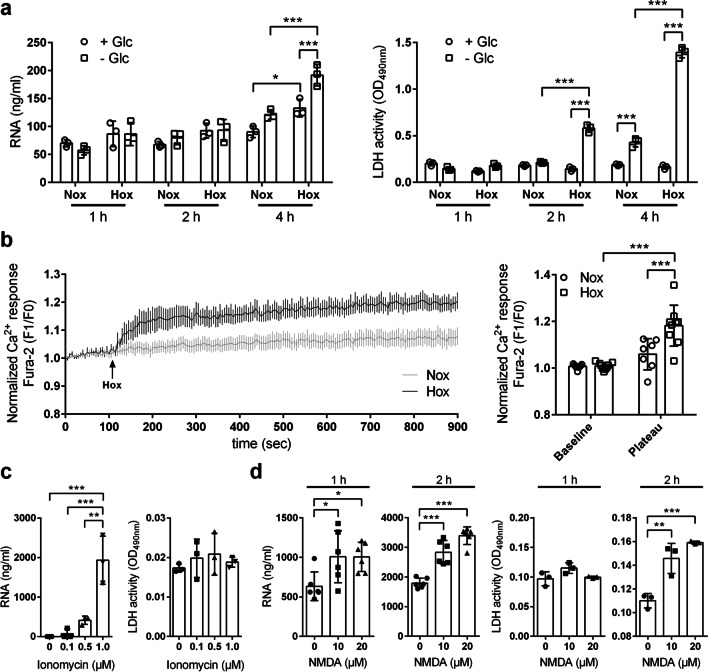
Fig. 5.
Hypoxia/ischemia and cytosolic calcium rises trigger neuronal RNA release. a Neuronal HT-22 cells were incubated in glucose-containing (+ Glc) or glucose-free (-Glc) medium under normoxic (Nox) or hypoxic (Hox; 1% O2) conditions for 1, 2 or 4 h. The eRNA levels in cellular supernatants were quantified by ELISA. Cell viability was determined by measuring extracellular LDH activity (n = 3 per group; Two-way ANOVA with Holm–Sidak's multiple comparisons test; * p < 0.05, ** p < 0.01, *** p < 0.001). b Cytoplasmic free calcium concentration in HT-22 cells exposed to normoxic or hypoxic conditions were determined using the ratiometric Ca2+ indicator dye Fura-2 AM (n = 7–9 per group; Two-way ANOVA with Holm–Sidak's multiple comparisons test; * p < 0.05, ** p < 0.01, *** p < 0.001). The normalized Ca2+ response is expressed as F1/F0 ratio (F1, Fura-2 340/380 ratio at indicated time point; F0, Fura-2 340/380 ratio at baseline). c Neuronal HT-22 cells were treated with 0.1, 0.5 or 1 µM ionomycin for 1 h. Untreated cells served as control. The eRNA levels in cellular supernatants were quantified by ELISA. Cell viability was determined by measuring extracellular LDH activity (n = 3 per group; One-way ANOVA with Holm–Sidak's multiple comparisons test; * p < 0.05, ** p < 0.01, *** p < 0.001). d Primary cortical neurons were treated with 10 or 20 µM NMDA in the presence of 10 µM glycine for 1 or 2 h. Cells treated with 10 µM glycine only were used as control. The eRNA concentration in cellular supernatants was quantified by ELISA. Cell viability was determined by measuring extracellular LDH activity (n = 3–6 per group; One-way ANOVA with Holm–Sidak's multiple comparisons test; *p < 0.05, ** p < 0.01, *** p < 0.001)

