Fig. 4.
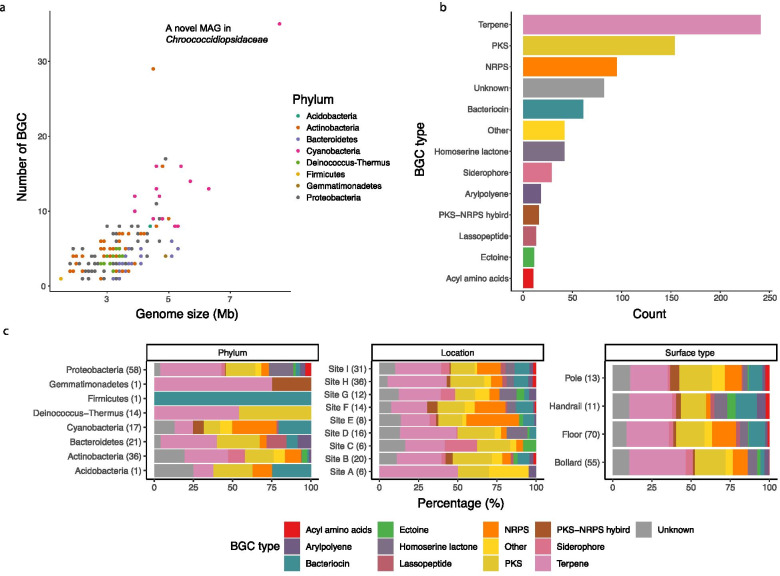
Secondary biosynthetic capacity of the MAGs. a Correlation between the genome size and the number of putative BGCs in each MAG. Each data point represents an MAG, colored by phylum classification. b Total number of each type of putative BGCs across all MAGs. c Relative abundance of the top 12 known BGC types across phylum (left), location (middle), and surface type (right). The total number of putative BGCs in each category is indicated in the brackets. All known types of putative BGCs that were present in < 1% of all of the putative BGCs were grouped into the “Other” category

