

ABSTRACT
Background
About 50% of Americans and 70% of US military service members use dietary supplements (DSs).
Objectives
This cross-sectional survey examined current prevalence of and factors associated with DS use in service members.
Methods
A stratified random sample of 200,000 service members from the Air Force, Army, Marine Corps, and Navy was obtained from military manpower records, and these service members were asked to complete a questionnaire on their DS use and personal characteristics. Chi-square statistics and multivariable logistic regression examined differences across various strata of demographic, lifestyle, and military characteristics.
Results
About 18% of successfully contacted service members (n = 26,681) completed the questionnaire between December 2018 and August 2019 (mean ± SD age: 33 ± 8 y, 86% male). Overall, 74% reported using ≥1 DS/wk. Multivitamins/multiminerals were the most commonly used DSs (45%), followed by combination products (44%), proteins/amino acids (42%), individual vitamins/minerals (31%), herbals (20%), joint health products (9%), and purported prohormones (5%). In multivariable analysis, factors independently associated with DS use included female gender [OR (female/male): 1.91; 95% CI: 1.73, 2.11], older age [OR (≥40/18–24 y): 1.25; 95% CI: 1.08, 1.44], higher education level [OR (college degree/high school or less): 1.35; 95% CI: 1.19, 1.53], higher BMI [OR (≥30/<25 kg/m2): 1.37; 95% CI: 1.25, 1.52], more weekly resistance training [OR (>300/≤45 min/wk): 5.05; 95% CI: 4.55, 5.61], smokeless tobacco use [OR (user/nonuser): 1.30; 95% CI: 1.17, 1.44], higher alcohol intake [OR (≥72/0 mL/wk): 1.41; 95% CI: 1.29, 1.54], and higher military rank [OR (senior officer/junior enlisted): 1.26; 95% CI: 1.06, 1.51].
Conclusions
Compared with civilian data from the NHANES, service members were much more likely to use DSs and used different types of DSs, especially combination products and proteins/amino acids often used to purportedly enhance physical performance. Comparisons with previous military data suggest DS use has increased over time.
Keywords: multivitamin/multimineral, vitamin, mineral, prohormone, combination products, herbals, joint health products
See corresponding editorial on page 3267.
Introduction
Dietary supplements (DSs) are commercially-available products consumed as an addition to the usual diet and include vitamins, minerals, herbs (botanicals), amino acids (AAs), and a variety of other products (1). Marketing claims for some DSs include improvements in overall health status, enhancement of cognitive or physical performance, increases in energy, loss of excess weight, attenuation of pain, and other favorable effects. Past studies indicate ∼50% of the US population (2, 3) and ∼70% of US military personnel use DSs (4–6). The types of DSs used by military personnel are considerably different than those used by civilians. For example, ∼33% of service members use protein/AA compounds (4, 6) compared with only 4% of civilians (7).
The Dietary Supplement Health and Education Act of 1994 (DSHEA) (1) established the regulatory structure for DSs in the United States. Since the DSHEA became law, US sales of DSs have increased from $4 billion in 1994 to $46 billion in 2018 (8, 9), a 12-fold increase over 25 y. Vitamin sales alone were $14 billion and sales of herbal substances exceeded $8 billion (9, 10). Under the DSHEA, the FDA has limited authority to regulate DSs. Manufacturers must notify the FDA 75 d before marketing a new DS, and although the FDA can review marketing claims, FDA approval is not required for retailing a DS product.
Because early studies (11–14) in selected military populations suggested a high use of DSs in the military, an Institute of Medicine report (15) recommended representative, comprehensive, and ongoing surveys of all military personnel to monitor the prevalence of DS use and to examine subgroups that might have higher DS use. Over a period of 9 y, from 2006 to 2014, our research team completed separate surveys of Army (16), Air Force (6), Navy/Marine Corps (4), and Coast Guard (17) personnel. These surveys used a similar questionnaire, but they were customized for the population surveyed and updated for DSs currently available to service members on military installations or in the local community (18). Most of these surveys (6, 16, 17) involved convenience samples. From 2006 to 2011, DS use appears to have increased among Army personnel (19), but it is not known if this trend has continued or is apparent in the other military services. The study reported here involves a comprehensive examination of current DS use in a stratified random sample of all military services using the same survey instrument and explores the current prevalence of and factors associated with DS use.
Methods
This investigation involved a cross-sectional survey completed by a stratified, random sample of US active duty military service members. The Naval Health Research Center (NHRC) Institutional Review Board approved the investigation and participants signed an informed consent document. Investigators adhered to policies and procedures for protection of human subjects as prescribed by Department of Defense Instruction 3216.01, and the research was conducted in adherence to provisions of 32 Code of Federal Regulations, Part 219.
Sampling frame
The Defense Manpower Data Center (DMDC) provided a list of a random sample of 200,000 service members currently on active duty with ≥6 mo of service and ≥1 y of estimated time before expected separation from service as of June 2018. The sample was stratified by sex (88% male and 12% female) and branch of service (Army 36%, Air Force 24%, Marine Corps 15%, and Navy 25%) based on military demographics in 2018. Data requested and obtained from the DMDC included the service member's name, identification number, service branch, sex, pay grade (rank), date of birth, marital status, race/ethnicity, education level, military occupational specialty code, postal address, and email address. The National Change of Address file provided by the US Postal Service was referenced to ensure the most up-to-date postal address was used.
The size of the sampling frame was determined based on subpopulation response rates of previous NHRC questionnaire investigations, a pilot study (4), and statistical power considerations. Previous investigations by the NHRC indicated that ∼75% of service members would be successfully contacted and ∼20% of service members would volunteer for the study. It was estimated that if use prevalence of a particular DS category was 20%, α error was set at ≤0.05, and β error at <0.20 (power ≥ 0.80), this would detect a difference in prevalence of 1.2 between various demographic, lifestyle, and military strata, and a sample of ∼5600 service members in each stratum would be needed. Thus, a comparison involving 5 equally sized strata would require 28,000 responders.
Solicitation procedures
Potential participants were contacted a maximum of 12 times. The first contact was an introductory postal letter including information about the purpose of the study, the investigators and their command affiliations, the sponsors, and the reason for conducting the study. The introductory letter provided the service member with a preincentive of $1 to increase the response rate (20, 21). The letter described the survey, included a link to a secure website, and provided a unique login used to access the survey and electronically sign the consent form. The subsequent contacts included ≤7 emails and ≤3 postcard reminders evenly distributed across the time the survey was open. Responders were taken off the distribution list, so the reminders were sent only to those who did not respond. The survey closed after 9 mo and responders were sent a “thank you” postcard for participating. All postal and email contacts stated that at any time the service member could decline participation and would be removed from the contact list. Recruitment began in December 2018, and no further recruitment was conducted nor surveys accepted after August 2019.
Survey description
The survey was similar to previous instruments (18) and designed to comprehensively describe participants and obtain types of DSs used and frequency of their use. To describe participants, there were questions on demographics (e.g., sex, age, education level, marital status, height, weight), lifestyle (amount of exercise, tobacco use, alcohol consumption), and military characteristics (rank, occupational assignment, service branch). Supplement use questions included 96 generic DSs [e.g., multivitamins/multiminerals (MVMs), individual vitamins and minerals, proteins/AAs, herbals, joint health products] and 62 brand name products. The brand name products included some of those used in previous armed forces studies (4, 16, 17), but some were updated based on a review of DS inventories in the Army, Navy, and Air Force Exchange Services and General Nutrition Center stores on or near military installations. There were also open-text fields on the questionnaire where service members could include supplements not on the provided lists. Service members were asked to estimate how frequently each supplement was used during the past 6 mo (“never,” “once a month,” “once a week,” “2–6 times/week,” or “daily”). Service members were also asked to estimate how much money they spent on supplements monthly. Table 1 provides the DS category definitions used in this study.
TABLE 1.
DS categories in study of US service members1
| Category | Definition |
|---|---|
| DS | Any substance defined by the DSHEA. |
| Multivitamin/Multimineral | DS containing ≥2 vitamins and/or ≥2 minerals with no additional supplement ingredients. |
| Protein or AA | AA mixtures, protein powders, and similar products where the intent is to provide a single AA or complex protein source. |
| Individual Vitamin or Mineral | DS that is a single vitamin or mineral supplement, such as vitamin D or calcium. |
| Herbal | DS that includes ≥1 herbal ingredients with no nutrient or other supplement ingredient. Includes plant-derived ingredients. |
| Purported Prohormone | Steroidal hormone or herbal substitute for hormones marketed as a DS and included on the Nutrition and Supplement Facts label. |
| Combination Product | DS with mixtures of ingredients from any of the above categories, including ≥2 categories and multiple ingredients. Includes products marketed as weight loss, pre- or postworkout supplements, and muscle/body-building products. |
| Joint Health Product | Substance that purports to improve the functioning of body joints, such as glucosamine (with or without chondroitin) or methylsulfonylmethane. |
| Other DS | Other DS that does not fit into the categories above. |
AA, amino acid; DS, dietary supplement; DSHEA, Dietary Supplement Health and Education Act of 1994 (1).
Data analyses
All statistical analyses were conducted using IBM SPSS Statistics version 26 (IBM). BMI was computed from the questionnaire responses as weight/height2 (in kg/m2). Weekly duration of aerobic and resistance training (min/wk) was calculated by multiplying reported weekly exercise frequency (sessions/wk) by reported duration of training (min/session). Alcohol consumption was quantified using the NIH assumption that a “standard drink” contained 17.74 mL alcohol (22). Standard drinks included 12 ounces (355 ml) of regular beer or fermented fruit drink (5% alcohol), 8.5 ounces (251 ml) of higher-alcohol beer (7% alcohol), 5 ounces (148 ml) of wine (12% alcohol), 4.25 ounces (125 ml) of fortified wine (15% alcohol), and 1.5 ounces (44 ml) of liquor (40% alcohol). Supplements that service members placed in the “other” categories were examined, and responses were placed into their proper DS category or listed as “other” supplements if they did not fit a defined DS category (Table 1).
Prevalence (%) ± SE was calculated for each DS. Chi-square statistics were used to examine differences across various strata of demographic, lifestyle, and military characteristics. Where variables were ordinal (i.e., age, education level, BMI, aerobic training duration, resistance training duration, and alcohol intake), chi-square tests for linear trend (Mantel–Haenszel statistic) were also performed. Multivariable logistic regression was used to examine associations between independent variables involving demographic, lifestyle, and military characteristics and dependent variables that included the DS categories. All demographic, lifestyle, and military characteristics were included (controlled for) in the models. Because some participants did not complete all questions, the number of service members is shown for each variable.
To address response bias, chi-square analyses compared responders and nonresponders by sex, education level, rank, and military service. t Tests were used to assess differences in age and time in service.
Results
Figure 1 presents subject flow during the investigation. From the initial sample frame of 200,000 service members, 73% (n = 146,365) were successfully contacted (i.e., there was no returned postal mail) and, of these, 26,681 (18.2%) signed the informed consent and completed the questionnaire.
FIGURE 1.
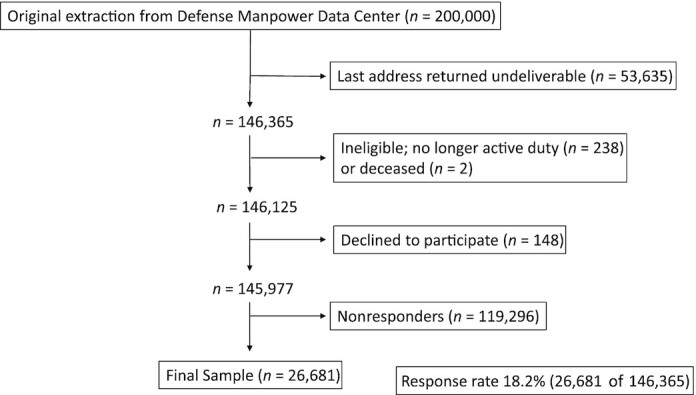
Flowchart summarizing service member recruitment, loss, and final responders.
The mean ± SD age, height, weight, and BMI of male responders was 32.8 ± 8.1 y, 178.3 ± 7.5 cm, 85.9 ± 12.6 kg, and 27.0 ± 3.4, respectively. These values for female responders were 32.0 ± 8.2 y, 164.6 ± 7.5 cm, 69.2 ± 11.7 kg, and 25.5 ± 3.8, respectively.
Overall prevalence and types of DSs used
Table 2 provides prevalence, number, and types of DSs consumed by service members in the past 6 mo. Seventy-four percent of service members reported using ≥1 DSs ≥1 times/wk. In descending order, the most commonly consumed DSs by category were MVMs, combination products, proteins/AAs, individual vitamins/minerals, other DSs, herbals, joint health products, and purported prohormones. The most often cited DS in the “other” category was fish oils (23.0% ± 0.5%). DS users spent a mean ± SD of $40 ± $55/mo on DSs, and 31.0% of users spent >$50/mo.
TABLE 2.
Prevalence of DS use by demographic, lifestyle, and military characteristics of US service members, based on self-report for the past 6 mo at the time of survey1
| Number of DSs taken ≥1 time/wk (% ± SE) | DSs taken ≥1 time/wk (% ± SE) | ||||||||||||
|---|---|---|---|---|---|---|---|---|---|---|---|---|---|
| Variable | Stratum | Any DS taken ≥1 time/wk (% ± SE) | 1–2 | 3–4 | ≥5 | Multivitamin/Multimineral | Individual Vitamin or Mineral | Protein or Amino Acid | Combination Product | Purported Prohormone | Herbal | Joint Health Product | Other DS |
| Group | All (n = 26,681) | 74.0 ± 0.3 | 19.9 ± 0.2 | 14.0 ± 0.2 | 40.1 ± 0.3 | 44.5 ± 0.3 | 30.8 ± 0.3 | 42.2 ± 0.3 | 44.4 ± 0.3 | 4.9 ± 0.1 | 20.2 ± 0.2 | 9.4 ± 0.2 | 30.6 ± 0.3 |
| Sex | Men (n = 23,038) | 73.2 ± 0.3 | 19.6 ± 0.3 | 13.6 ± 0.2 | 40.0 ± 0.3 | 43.1 ± 0.3 | 28.7 ± 0.3 | 43.8 ± 0.3 | 45.3 ± 0.3 | 5.5 ± 0.2 | 18.5 ± 0.3 | 9.2 ± 0.2 | 30.4 ± 0.3 |
| Women (n = 3642) | 79.0 ± 0.7 | 21.4 ± 0.7 | 16.9 ± 0.6 | 40.7 ± 0.5 | 53.8 ± 0.8 | 44.6 ± 0.8 | 32.0 ± 0.8 | 38.4 ± 0.8 | 0.8 ± 0.1 | 30.4 ± 0.8 | 11.1 ± 0.5 | 32.2 ± 0.8 | |
| P value (chi-square) | <0.01 | <0.01 | <0.01 | <0.01 | <0.01 | <0.01 | <0.01 | <0.01 | <0.01 | 0.03 | |||
| Age, y | 18–24 (n = 4660) | 68.4 ± 0.7 | 18.0 ± 0.6 | 11.7 ± 0.5 | 38.8 ± 0.7 | 33.8 ± 0.6 | 25.8 ± 0.6 | 45.2 ± 0.7 | 46.4 ± 0.7 | 3.8 ± 0.3 | 16.0 ± 0.5 | 3.7 ± 0.3 | 26.1 ± 0.6 |
| 25–29 (n = 5580) | 75.6 ± 0.6 | 17.7 ± 0.5 | 14.5 ± 0.5 | 43.4 ± 0.7 | 44.1 ± 0.7 | 29.3 ± 0.6 | 49.8 ± 0.7 | 48.7 ± 0.7 | 4.2 ± 0.3 | 20.2 ± 0.5 | 7.6 ± 0.4 | 31.5 ± 0.6 | |
| 30–39 (n = 11,031) | 75.7 ± 0.4 | 20.6 ± 0.4 | 14.2 ± 0.3 | 40.9 ± 0.5 | 47.8 ± 0.5 | 31.3 ± 0.4 | 43.0 ± 0.5 | 45.6 ± 0.5 | 5.2 ± 0.2 | 20.8 ± 0.4 | 11.0 ± 0.3 | 31.0 ± 0.4 | |
| ≥40 (n = 5275) | 73.7 ± 0.6 | 22.2 ± 0.6 | 15.1 ± 0.5 | 36.3 ± 0.7 | 48.4 ± 0.7 | 35.9 ± 0.7 | 30.9 ± 0.6 | 36.2 ± 0.7 | 5.9 ± 0.3 | 22.3 ± 0.6 | 13.0 ± 0.5 | 33.0 ± 0.6 | |
| P value (chi-square/trend) | <0.01/<0.01 | <0.01 | <0.01/<0.01 | <0.01/<0.01 | <0.01/<0.01 | <0.01/<0.01 | <0.01/<0.01 | <0.01/<0.01 | <0.01/<0.01 | <0.01/<0.01 | |||
| Education level | Some HS/HS grad (n = 3879) | 66.2 ± 0.8 | 18.5 ± 0.6 | 10.6 ± 0.5 | 37.0 ± 0.8 | 32.3 ± 0.8 | 23.5 ± 0.7 | 41.3 ± 0.8 | 45.6 ± 0.8 | 5.0 ± 0.5 | 14.9 ± 0.6 | 4.8 ± 0.3 | 24.3 ± 0.7 |
| Some college (n = 11,378) | 75.0 ± 0.4 | 18.7 ± 0.4 | 13.6 ± 0.3 | 42.7 ± 0.5 | 44.5 ± 0.5 | 31.2 ± 0.4 | 44.3 ± 0.5 | 48.5 ± 0.5 | 5.4 ± 0.2 | 20.2 ± 0.4 | 9.0 ± 0.3 | 31.4 ± 0.4 | |
| College degree (n = 11,418) | 75.6 ± 0.4 | 21.6 ± 0.4 | 15.6 ± 0.3 | 38.5 ± 0.5 | 48.8 ± 0.5 | 32.9 ± 0.4 | 40.5 ± 0.5 | 39.9 ± 0.5 | 4.3 ± 0.2 | 21.9 ± 0.4 | 11.3 ± 0.3 | 32.0 ± 0.4 | |
| P value (chi-square/trend) | <0.01/<0.01 | <0.01 | <0.01/<0.01 | <0.01/<0.01 | <0.01/0.12 | <0.01/0.15 | <0.01/0.20 | <0.01/<0.01 | <0.01/<0.1 | <0.01/<0.01 | |||
| Marital status | Never married (n = 6471) | 71.8 ± 0.6 | 18.0 ± 0.5 | 12.9 ± 0.4 | 40.9 ± 0.6 | 40.1 ± 0.6 | 29.1 ± 0.6 | 45.7 ± 0.6 | 46.1 ± 0.6 | 4.0 ± 0.2 | 18.7 ± 0.5 | 6.7 ± 0.3 | 29.8 ± 0.6 |
| Married (n = 17,686) | 74.2 ± 0.3 | 20.9 ± 0.3 | 14.5 ± 0.3 | 38.8 ± 0.4 | 45.8 ± 0.4 | 30.6 ± 0.3 | 40.5 ± 0.4 | 43.2 ± 0.4 | 4.8 ± 0.2 | 20.2 ± 0.3 | 9.9 ± 0.2 | 30.3 ± 0.4 | |
| Sep, wid, div (n = 2145) | 79.0 ± 0.9 | 16.7 ± 0.8 | 13.2 ± 0.7 | 49.1 ± 1.1 | 48.2 ± 1.1 | 38.4 ± 1.1 | 47.3 ± 1.1 | 50.5 ± 1.1 | 8.1 ± 0.6 | 24.8 ± 0.9 | 13.6 ± 0.7 | 36.7 ± 1.0 | |
| P value (chi-square) | <0.01 | <0.01 | <0.01 | <0.01 | <0.01 | <0.01 | <0.01 | <0.01 | <0.01 | <0.01 | |||
| BMI, kg/m2 | <25.0 (n = 7856) | 70.0 ± 0.5 | 21.6 ± 0.5 | 14.2 ± 0.4 | 34.3 ± 0.5 | 40.4 ± 0.6 | 29.7 ± 0.5 | 38.0 ± 0.5 | 36.5 ± 0.5 | 2.6 ± 0.2 | 19.6 ± 0.4 | 7.2 ± 0.3 | 26.6 ± 0.5 |
| 25.0–29.9 (n = 13,898) | 75.2 ± 0.4 | 19.3 ± 0.3 | 14.2 ± 0.3 | 41.7 ± 0.4 | 45.8 ± 0.4 | 30.5 ± 0.4 | 44.3 ± 0.4 | 46.4 ± 0.4 | 5.3 ± 0.2 | 20.0 ± 0.3 | 10.1 ± 0.3 | 31.9 ± 0.4 | |
| ≥30.0 (n = 4424) | 78.0 ± 0.6 | 18.9 ± 0.6 | 13.3 ± 0.5 | 45.8 ± 0.7 | 48.8 ± 0.8 | 34.0 ± 0.7 | 43.6 ± 0.7 | 52.6 ± 0.8 | 7.6 ± 0.4 | 22.0 ± 0.6 | 11.2 ± 0.5 | 34.4 ± 0.7 | |
| P value (chi-square/trend) | <0.01/0.01 | <0.01 | <0.01/<0.01 | <0.01/<0.01 | <0.01/<0.01 | <0.01/<0.01 | <0.01/<0.01 | <0.01/0.01 | <0.01/<0.01 | <0.01/<0.01 | |||
| Aerobic exercise duration, min/wk | 0–90 (n = 7287) | 71.7 ± 0.5 | 20.0 ± 0.5 | 13.8 ± 0.4 | 37.9 ± 0.6 | 42.1 ± 0.6 | 28.7 ± 0.5 | 40.1 ± 0.6 | 41.9 ± 0.6 | 4.1 ± 0.2 | 18.3 ± 0.5 | 8.0 ± 0.3 | 28.8 ± 0.5 |
| 91–180 (n = 7285) | 71.7 ± 0.5 | 22.7 ± 0.5 | 14.8 ± 0.4 | 34.2 ± 0.6 | 43.0 ± 0.6 | 28.5 ± 0.5 | 37.2 ± 0.6 | 39.0 ± 0.6 | 3.9 ± 0.2 | 18.5 ± 0.5 | 8.5 ± 0.3 | 27.8 ± 0.5 | |
| 181–300 (n = 5869) | 75.1 ± 0.6 | 20.1 ± 0.5 | 14.3 ± 0.5 | 40.7 ± 0.6 | 45.6 ± 0.7 | 31.1 ± 0.6 | 42.5 ± 0.6 | 45.4 ± 0.7 | 5.0 ± 0.3 | 21.0 ± 0.5 | 10.5 ± 0.4 | 31.5 ± 0.6 | |
| >300 (n = 6240) | 78.2 ± 0.5 | 16.2 ± 0.5 | 13.1 ± 0.4 | 48.9 ± 0.6 | 48.1 ± 0.6 | 35.8 ± 0.6 | 50.3 ± 0.6 | 52.6 ± 0.6 | 6.8 ± 0.3 | 23.5 ± 0.5 | 11.0 ± 0.4 | 35.3 ± 0.6 | |
| P value (chi-square/trend) | <0.01/<0.01 | <0.01 | <0.01/<0.01 | <0.01/<0.01 | <0.01/<0.1 | <0.01/<0.01 | <0.01/<0.01 | <0.01/<0.01 | <0.01/<0.01 | <0.01/<0.01 | |||
| Resistance training duration, min/wk | ≤45 (n = 7776) | 62.3 ± 0.6 | 26.2 ± 0.5 | 14.0 ± 0.4 | 22.1 ± 0.5 | 37.6 ± 0.5 | 26.4 ± 0.5 | 18.5 ± 0.4 | 26.8 ± 0.5 | 2.0 ± 0.2 | 16.1 ± 0.4 | 5.9 ± 0.3 | 21.0 ± 0.5 |
| 46–135 (n = 6257) | 70.0 ± 0.6 | 23.7 ± 0.5 | 15.9 ± 0.5 | 30.4 ± 0.6 | 42.0 ± 0.6 | 28.5 ± 0.6 | 32.4 ± 0.6 | 34.2 ± 0.6 | 2.8 ± 0.2 | 19.4 ± 0.5 | 7.9 ± 0.3 | 26.6 ± 0.6 | |
| 136–300 (n = 6582) | 80.2 ± 0.5 | 17.2 ± 0.5 | 15.2 ± 0.4 | 47.9 ± 0.6 | 47.5 ± 0.6 | 31.9 ± 0.6 | 54.4 ± 0.6 | 52.8 ± 0.6 | 5.3 ± 0.3 | 21.2 ± 0.5 | 11.3 ± 0.4 | 34.4 ± 0.6 | |
| >300 (n = 6066) | 86.2 ± 0.4 | 10.6 ± 0.4 | 10.9 ± 0.4 | 64.6 ± 0.6 | 52.9 ± 0.6 | 37.8 ± 0.6 | 69.5 ± 0.6 | 68.3 ± 0.6 | 10.3 ± 0.4 | 25.0 ± 0.6 | 13.5 ± 0.4 | 43.0 ± 0.6 | |
| P value (chi-square/trend) | <0.01/<0.01 | <0.01 | <0.01/<0.01 | <0.01/<0.01 | <0.01/<0.01 | <0.01/<0.01 | <0.01/<0.01 | <0.01/<0.01 | <0.01/<0.01 | <0.01/<0.01 | |||
| Smoking | Never smoked (n = 16,706) | 73.0 ± 0.3 | 20.2 ± 0.3 | 14.1 ± 0.3 | 38.6 ± 0.4 | 45.1 ± 0.4 | 31.2 ± 0.4 | 40.9 ± 0.4 | 41.4 ± 0.4 | 4.2 ± 0.2 | 20.2 ± 0.3 | 9.6 ± 0.2 | 30.3 ± 0.4 |
| Smoked but quit (n = 4767) | 77.3 ± 0.6 | 19.1 ± 0.6 | 14.5 ± 0.5 | 43.7 ± 0.7 | 46.3 ± 0.7 | 31.6 ± 0.7 | 45.3 ± 0.7 | 48.9 ± 0.7 | 5.8 ± 0.3 | 20.7 ± 0.6 | 10.5 ± 0.4 | 33.6 ± 0.7 | |
| Smoker (n = 4512) | 75.2 ± 0.6 | 19.8 ± 0.6 | 13.5 ± 0.5 | 41.9 ± 0.7 | 41.6 ± 0.7 | 29.1 ± 0.7 | 44.4 ± 0.7 | 51.1 ± 0.7 | 6.3 ± 0.4 | 20.1 ± 0.6 | 8.4 ± 0.4 | 30.1 ± 0.7 | |
| P value (chi-square) | <0.01 | <0.01 | <0.01 | 0.01 | <0.01 | <0.01 | <0.01 | 0.72 | <0.01 | <0.01 | |||
| Smokeless tobacco use | Never used (n = 20,379) | 72.8 ± 0.3 | 20.4 ± 0.3 | 14.2 ± 0.2 | 38.1 ± 0.3 | 44.4 ± 0.3 | 31.0 ± 0.3 | 40.2 ± 0.3 | 41.6 ± 0.3 | 4.2 ± 0.1 | 20.2 ± 0.3 | 9.2 ± 0.2 | 29.8 ± 0.3 |
| Used but quit (n = 2047) | 79.5 ± 0.9 | 19.1 ± 0.9 | 15.2 ± 0.8 | 45.2 ± 1.1 | 45.6 ± 1.1 | 30.9 ± 1.0 | 48.5 ± 1.1 | 52.8 ± 1.1 | 6.5 ± 0.5 | 21.4 ± 0.9 | 10.9 ± 0.7 | 33.9 ± 1.0 | |
| User (n = 3114) | 79.2 ± 0.7 | 17.6 ± 0.7 | 12.7 ± 0.6 | 49.0 ± 0.9 | 45.3 ± 0.9 | 29.4 ± 0.8 | 52.6 ± 0.9 | 57.5 ± 0.9 | 8.3 ± 0.5 | 19.7 ± 0.7 | 10.6 ± 0.6 | 35.7 ± 0.9 | |
| P value (chi-square) | <0.01 | <0.01 | 0.43 | 0.17 | <0.01 | <0.01 | <0.01 | 0.32 | 0.01 | <0.01 | |||
| Alcohol intake,2 mL/wk | 0 (n = 8372) | 69.4 ± 0.5 | 19.3 ± 0.4 | 12.8 ± 0.4 | 37.3 ± 0.5 | 41.7 ± 0.5 | 30.5 ± 0.5 | 38.0 ± 0.5 | 39.8 ± 0.5 | 4.3 ± 0.2 | 17.8 ± 0.4 | 7.4 ± 0.3 | 27.1 ± 0.5 |
| 0.2–24.9 (n = 6132) | 74.0 ± 0.5 | 21.4 ± 0.5 | 14.0 ± 0.4 | 38.6 ± 0.6 | 44.9 ± 0.6 | 31.7 ± 0.6 | 39.7 ± 0.6 | 42.9 ± 0.6 | 4.1 ± 0.3 | 21.1 ± 0.5 | 9.9 ± 0.4 | 30.7 ± 0.6 | |
| 25.0–71.7 (n = 6108) | 76.9 ± 0.5 | 19.4 ± 0.5 | 15.0 ± 0.5 | 42.5 ± 0.6 | 46.7 ± 0.6 | 31.2 ± 0.6 | 46.0 ± 0.6 | 47.8 ± 0.6 | 5.1 ± 0.3 | 20.9 ± 0.5 | 10.3 ± 0.4 | 32.5 ± 0.6 | |
| >71.7 (n = 6068) | 77.2 ± 0.5 | 19.6 ± 0.5 | 14.7 ± 0.5 | 43.0 ± 0.6 | 45.9 ± 0.6 | 30.0 ± 0.6 | 46.8 ± 0.6 | 48.8 ± 0.6 | 6.2 ± 0.3 | 21.7 ± 0.5 | 10.9 ± 0.4 | 33.5 ± 0.6 | |
| P value (chi-square/trend) | <0.01/<0.01 | <0.01 | <0.01/<0.01 | 0.20/0.57 | <0.01/<0.01 | <0.01/<0.01 | <0.01/<0.01 | <0.01/<0.01 | <0.01/<0.01 | <0.01/<0.01 | |||
| Rank3 | Junior enlisted (n = 2496) | 66.4 ± 0.9 | 18.7 ± 0.8 | 11.9 ± 0.6 | 35.8 ± 1.0 | 32.9 ± 0.9 | 35.8 ± 1.0 | 32.9 ± 0.9 | 27.6 ± 0.9 | 48.8 ± 1.0 | 43.2 ± 1.0 | 3.1 ± 0.3 | 16.3 ± 0.7 |
| Mid-enlisted (n = 11,609) | 73.6 ± 0.4 | 18.0 ± 0.4 | 12.9 ± 0.3 | 42.9 ± 0.5 | 42.9 ± 0.5 | 42.7 ± 0.5 | 42.9 ± 0.5 | 30.2 ± 0.4 | 44.6 ± 0.5 | 48.6 ± 0.5 | 5.4 ± 0.2 | 19.9 ± 0.4 | |
| Senior enlisted (n = 4365) | 76.7 ± 0.6 | 21.1 ± 0.6 | 14.8 ± 0.5 | 40.8 ± 0.7 | 48.0 ± 0.8 | 40.8 ± 0.7 | 48.0 ± 0.6 | 32.9 ± 0.7 | 40.3 ± 0.7 | 45.9 ± 0.8 | 7.0 ± 0.4 | 20.9 ± 0.6 | |
| Warrant officer (n = 576) | 74.1 ± 1.8 | 17.4 ± 1.6 | 14.2 ± 1.5 | 42.5 ± 2.1 | 47.6 ± 2.8 | 42.5 ± 2.1 | 47.6 ± 2.1 | 30.2 ± 1.9 | 41.3 ± 2.1 | 46.2 ± 2.1 | 8.0 ± 1.1 | 20.5 ± 1.7 | |
| Junior officer (n = 3892) | 77.1 ± 0.7 | 21.5 ± 0.7 | 39.7 ± 0.8 | 39.7 ± 0.8 | 47.0 ± 0.8 | 39.7 ± 0.8 | 47.0 ± 0.8 | 29.2 ± 0.7 | 48.0 ± 0.8 | 43.2 ± 0.8 | 3.2 ± 0.3 | 21.5 ± 0.7 | |
| Senior officer (n = 3742) | 73.6 ± 0.7 | 23.9 ± 0.7 | 15.8 ± 0.6 | 33.9 ± 0.8 | 50.2 ± 0.8 | 33.9 ± 0.8 | 50.2 ± 0.8 | 34.3 ± 0.8 | 32.1 ± 0.8 | 31.3 ± 0.8 | 3.3 ± 0.3 | 21.1 ± 0.7 | |
| P value (chi-square) | <0.01 | <0.01 | <0.01 | <0.01 | <0.01 | <0.01 | <0.01 | <0.01 | <0.01 | <0.01 | |||
| Military occupational specialty | CA (n = 6451) | 75.8 ± 0.5 | 19.3 ± 0.5 | 14.1 ± 0.4 | 42.4 ± 0.6 | 45.2 ± 0.6 | 29.3 ± 0.6 | 47.0 ± 0.6 | 47.4 ± 0.6 | 5.7 ± 0.3 | 20.1 ± 0.5 | 11.0 ± 0.4 | 32.1 ± 0.6 |
| CS (n = 10,424) | 73.5 ± 0.4 | 19.0 ± 0.4 | 13.9 ± 0.3 | 40.7 ± 0.5 | 44.4 ± 0.5 | 30.3 ± 0.5 | 43.5 ± 0.5 | 45.0 ± 0.5 | 4.9 ± 0.2 | 19.6 ± 0.4 | 9.2 ± 0.3 | 30.6 ± 0.5 | |
| CSS (n = 9133) | 73.5 ± 0.5 | 21.1 ± 0.4 | 14.1 ± 0.4 | 38.3 ± 0.5 | 44.5 ± 0.5 | 32.7 ± 0.5 | 38.1 ± 0.5 | 42.0 ± 0.5 | 4.3 ± 0.2 | 21.0 ± 0.4 | 8.7 ± 0.3 | 30.1 ± 0.5 | |
| P value (chi-square) | <0.01 | <0.01 | 0.54 | <0.01 | <0.01 | <0.01 | <0.01 | 0.04 | <0.01 | 0.03 | |||
| Service branch | Air Force (n = 9789) | 73.0 ± 0.4 | 20.8 ± 0.4 | 14.9 ± 0.4 | 37.2 ± 0.5 | 44.9 ± 0.5 | 30.7 ± 0.5 | 40.7 ± 0.5 | 41.3 ± 0.5 | 3.2 ± 0.2 | 18.4 ± 0.4 | 8.6 ± 0.3 | 29.2 ± 0.5 |
| Army (n = 7935) | 75.6 ± 0.5 | 18.9 ± 0.4 | 13.5 ± 0.4 | 43.1 ± 0.6 | 45.6 ± 0.6 | 32.2 ± 0.5 | 44.1 ± 0.6 | 47.6 ± 0.6 | 6.6 ± 0.3 | 21.4 ± 0.5 | 10.9 ± 0.4 | 31.9 ± 0.5 | |
| Marine Corps (n = 3194) | 74.5 ± 0.7 | 16.0 ± 0.6 | 12.6 ± 0.6 | 45.8 ± 0.9 | 40.1 ± 0.9 | 26.4 ± 0.8 | 51.8 ± 0.9 | 51.8 ± 0.9 | 6.5 ± 0.4 | 18.3 ± 0.7 | 8.8 ± 0.5 | 31.1 ± 0.8 | |
| Navy (n = 5763) | 73.1 ± 0.6 | 21.7 ± 0.5 | 14.0 ± 0.5 | 37.4 ± 0.6 | 45.0 + 0.7 | 31.6 ± 0.6 | 36.9 ± 0.6 | 41.1 ± 0.6 | 4.4 ± 0.3 | 22.4 ± 0.5 | 9.1 ± 0.4 | 31.1 ± 0.6 | |
| P value (chi-square) | <0.01 | <0.01 | <0.01 | <0.01 | <0.01 | <0.01 | <0.01 | <0.01 | <0.01 | <0.01 | |||
Sums for sample sizes may not equal the total sample size because some participants did not answer all the questions. CA, combat arms; CS, combat support; CSS, combat service support; DS, dietary supplement; Grad, graduate; HS, high school; Sep, wid, div, separated, widowed, divorced.
Alcohol consumption: 0.2–24.9 mL/wk = 0.0–1.4 standard drinks; 25.0–71.7 mL/wk = 1.4–4.0 standard drinks; ≥71.7 mL/wk = >4.0 standard drinks.
For rank: junior enlisted, E1–E4; mid-enlisted, E5–E6; senior enlisted, E7–E9; junior officer, O1–O3; senior officer, O4–O7.
Factors associated with DS use
Table 2 shows that a larger proportion of women reported taking DSs, especially MVMs, individual vitamins/minerals, herbals, joint health products, and other DSs; a greater proportion of men reported taking proteins/AAs, combination products, and purported prohormones. The proportion of service members taking DSs generally increased with age, especially MVMs, individual vitamins/minerals, purported prohormones, herbals, joint health products, and other DSs, but generally decreased with age for proteins/AAs and combination products. The proportion of service members taking DSs generally increased with increasing education level, especially MVMs, individual vitamins/minerals, herbals, joint health products, and other DSs; service members with some college education reported using more proteins/AAs, combination products, and purported prohormones. Service members who were separated, widowed, or divorced reported more use of DSs in all categories. As BMI increased, so did the DS use in all categories.
Use of DSs in all categories generally increased with an increase in weekly duration of aerobic training or resistance training. The correlation between weekly aerobic exercise time and weekly resistance training time was 0.61 (P < 0.01). Service members who smoked but quit had significantly higher use of DSs than the other 2 groups, especially for MVMs, individual vitamins/minerals, proteins/AAs, joint health products, and other DSs; smokers had significantly higher use of combination products and purported prohormones than the other 2 groups. Smokeless tobacco users who had quit or were still using had the highest DS use, especially proteins/AAs, combination products, purported prohormones, joint health products, and other DSs. As alcohol intake increased there was generally an increase in the use of DSs in all categories except for individual vitamins/minerals.
DS use increased as enlisted rank increased, especially MVMs, proteins/AAs, combination products, joint health products, and other DSs; DS use decreased with rank for purported prohormones and was highest among mid-enlisted service members for individual vitamins/minerals and herbals. Junior officers were more likely to take DSs, especially individual vitamins/minerals, purported prohormones, and herbals, whereas senior officers were more likely to use proteins/AAs and combination products. Those in combat arms occupations had higher use of DSs in most categories except individual vitamins/minerals and herbals, where combat service support had the highest use. Air Force personnel reported significantly lower overall use of DSs and Army personnel significantly higher use than the other services. Compared with the other services, Army personnel reported significantly higher use of MVMs, individual vitamins/minerals, purported prohormones, joint health products, and other DSs. Compared with the other services, Marine Corps personnel had significantly higher use of proteins/AAs and combination products, whereas Navy personnel had significantly higher use of herbals.
Service members taking DSs were more likely to take ≥5 DSs than 1–2 or 3–4 DSs. The proportion of service members using ≥5 DSs generally increased with an increase in BMI, aerobic training, resistance training, and/or alcohol intake and was highest among Army and Marine Corps personnel.
Multivariable regression
Table 3 presents results of the multivariable logistic regression examining factors associated with DS use. The results presented are for 9 full models with all characteristics entered into the logistic regression. There were 24,010 service members who had complete data on all variables, so 90.0% of participants were included in these analyses.
TABLE 3.
Multivariable analysis of factors associated with DS use (≥1 time/wk) among US service members, based on self-report for the past 6 mo at the time of survey1
| Variable | Stratum | Any DS | Use of ≥5 DSs | Multivitamin/Multimineral | Individual Vitamin/Mineral | Protein or Amino Acid | Combination Product | Purported Prohormone | Herbal | Joint Health Product |
|---|---|---|---|---|---|---|---|---|---|---|
| Sex | Male | 1.00 | 1.00 | 1.00 | 1.00 | 1.00 | 1.00 | 1.00 | 1.00 | 1.00 |
| Female | 1.91 (1.73, 2.11) | 1.54 (1.41, 1.68) | 1.88 (1.74, 2.05) | 2.25 (2.07, 2.44) | 0.86 (0.79, 0.95) | 1.06 (0.97, 1.14) | 0.22 (0.15, 0.33) | 2.26 (2.06, 2.48) | 1.73 (1.52, 1.98) | |
| Age, y | 18–24 | 1.00 | 1.00 | 1.00 | 1.00 | 1.00 | 1.00 | 1.00 | 1.00 | 1.00 |
| 25–29 | 1.20 (1.07, 1.34) | 1.13 (1.02, 1.26) | 1.33 (1.20, 1.46) | 1.20 (1.07, 1.33) | 1.05 (0.94, 1.17) | 1.04 (0.94, 1.15) | 1.05 (0.83, 1.34) | 1.19 (1.05, 1.35) | 1.88 (1.52, 2.33) | |
| 30–39 | 1.27 (1.13, 1.43) | 1.22 (1.09, 1.36) | 1.53 (1.38, 1.70) | 1.43 (1.28, 1.60) | 0.90 (0.81, 1.01) | 1.07 (0.96, 1.19) | 1.54 (1.20, 1.98) | 1.32 (1.16, 1.50) | 3.00 (2.41, 3.72) | |
| ≥40 | 1.25 (1.08, 1.44) | 1.23 (1.07, 1.41) | 1.58 (1.39, 1.80) | 1.86 (1.62, 2.14) | 0.62 (0.54, 0.71) | 0.91 (0.79, 1.04) | 2.28 (1.70, 3.07) | 1.57 (1.34, 1.84) | 3.94 (3.08, 5.02) | |
| Education level | Some HS/HS grad | 1.00 | 1.00 | 1.00 | 1.00 | 1.00 | 1.00 | 1.00 | 1.00 | 1.00 |
| Some college | 1.29 (1.17, 1.43) | 1.25 (1.13, 1.37) | 1.32 (1.20, 1.44) | 1.24 (1.12, 1.37) | 1.26 (1.14, 1.39) | 1.12 (1.02, 1.22) | 0.97 (0.80, 1.18) | 1.25 (1.11, 1.40) | 1.23 (1.03, 1.47) | |
| College degree | 1.35 (1.19, 1.53) | 1.30 (1.15, 1.46) | 1.47 (1.31, 1.65) | 1.36 (1.21, 1.54) | 1.34 (1.19, 1.52) | 1.10 (0.98, 1.24) | 1.13 (0.88, 1.44) | 1.41 (1.22, 1.62) | 1.31 (1.07, 1.62) | |
| Marital status | Never married | 1.00 | 1.00 | 1.00 | 1.00 | 1.00 | 1.00 | 1.00 | 1.00 | 1.00 |
| Married | 0.96 (0.88, 1.04) | 1.08 (1.00, 1.16) | 0.98 (0.91, 1.06) | 1.05 (0.97, 1.13) | 1.06 (0.98, 1.14) | 1.04 (0.96, 1.12) | 1.14 (0.95, 1.36) | 0.99 (0.91, 1.08) | 1.06 (0.94, 1.22) | |
| Sep, wid, div | 1.07 (0.95, 1.21) | 1.29 (1.17, 1.43) | 0.96 (0.87, 1.05) | 1.19 (1.08, 1.33) | 1.21 (1.09, 1.35) | 1.18 (1.07, 1.31) | 1.82 (1.51, 2.19) | 1.10 (0.98, 1.23) | 1.34 (1.16, 1.54) | |
| BMI, kg/m2 | <25.0 | 1.00 | 1.00 | 1.00 | 1.00 | 1.00 | 1.00 | 1.00 | 1.00 | 1.00 |
| 25.0–29.9 | 1.18 (1.10, 1.26) | 1.25 (1.17, 1.33) | 1.18 (1.11, 1.25) | 1.05 (0.98, 1.12) | 1.14 (1.06, 1.22) | 1.37 (1.28, 1.46) | 1.41 (1.19, 1.67) | 1.05 (0.97, 1.13) | 1.21 (1.08, 1.35) | |
| ≥30.0 | 1.37 (1.25, 1.52) | 1.53 (1.41, 1.68) | 1.34 (1.24, 1.46) | 1.18 (1.08, 1.28) | 1.20 (1.10, 1.32) | 1.82 (1.67, 1.98) | 1.96 (1.61, 2.38) | 1.17 (1.06, 1.30) | 1.32 (1.15, 1.51) | |
| Aerobic exercise duration, min/wk | ≤90 | 1.00 | 1.00 | 1.00 | 1.00 | 1.00 | 1.00 | 1.00 | 1.00 | 1.00 |
| 91–180 | 0.87 (0.81, 0.95) | 0.78 (0.72, 0.84) | 0.95 (0.89, 1.02) | 0.92 (0.85, 1.00) | 0.79 (0.73, 0.86) | 0.83 (0.77, 0.89) | 0.90 (0.75, 1.08) | 0.95 (0.87, 1.04) | 0.98 (0.87, 1.12) | |
| 181–300 | 0.90 (0.82, 0.99) | 0.83 (0.76, 0.90) | 0.99 (0.92, 1.07) | 1.01 (0.92, 1.09) | 0.75 (0.68, 0.81) | 0.88 (0.81, 0.96) | 0.92 (0.76, 1.10) | 1.07 (0.97, 1.17) | 1.04 (0.91, 1.19) | |
| >300 | 0.79 (0.71, 0.86) | 0.73 (0.67, 0.80) | 0.96 (0.89, 1.04) | 1.10 (1.01, 1.20) | 0.61 (0.55, 0.66) | 0.74 (0.68, 0.81) | 0.81 (0.68, 0.98) | 1.08 (0.98, 1.19) | 0.93 (0.81, 1.07) | |
| Resistance training duration, min/wk | ≤45 | 1.00 | 1.00 | 1.00 | 1.00 | 1.00 | 1.00 | 1.00 | 1.00 | 1.00 |
| 46–135 | 1.50 (1.38, 1.62) | 1.71 (1.57, 1.86) | 1.24 (1.15, 1.34) | 1.16 (1.07, 1.26) | 2.40 (2.20, 2.62) | 1.54 (1.43, 1.67) | 1.55 (1.21, 1.98) | 1.29 (1.18, 1.42) | 1.43 (1.24, 1.65) | |
| 136–300 | 2.83 (2.59, 3.09) | 3.82 (3.52, 4.15) | 1.69 (1.57, 1.82) | 1.49 (1.37, 1.61) | 6.11 (5.60, 6.66) | 3.25 (3.00, 3.52) | 2.90 (2.32, 3.62) | 1.54 (1.40, 1.69) | 2.31 (2.02, 2.65) | |
| >300 | 5.05 (4.55, 5.61) | 8.21 (7.48, 9.00) | 2.39 (2.20, 2.60) | 2.04 (1.86, 2.23) | 13.09 (11.87, 14.44) | 6.39 (5.84, 6.99) | 6.15 (4.93, 7.67) | 2.05 (1.85, 2.27) | 3.47 (2.99, 4.01) | |
| Smoking | Never smoked | 1.00 | 1.00 | 1.00 | 1.00 | 1.00 | 1.00 | 1.00 | 1.00 | 1.00 |
| Smoked but quit | 1.14 (1.04, 1.24) | 1.10 (1.01, 1.19) | 1.01 (0.94, 1.09) | 1.02 (0.94, 1.10) | 1.12 (1.03, 1.22) | 1.12 (1.03, 1.21) | 0.98 (0.82, 1.14) | 0.99 (0.90, 1.09) | 0.97 (0.86, 1.10) | |
| Smoker | 1.03 (0.95, 1.13) | 0.99 (0.91, 1.07) | 0.91 (0.84, 0.98) | 0.99 (0.91, 1.07) | 0.93 (0.85, 1.01) | 1.17 (1.08, 1.26) | 1.10 (0.93, 1.29) | 1.02 (0.93, 1.12) | 0.85 (0.75, 0.97) | |
| Smokeless tobacco use | Never used | 1.00 | 1.00 | 1.00 | 1.00 | 1.00 | 1.00 | 1.00 | 1.00 | 1.00 |
| Used but quit | 1.39 (1.22, 1.57) | 1.21 (1.08, 1.34) | 1.08 (0.98, 1.20) | 1.08 (0.97, 1.20) | 1.20 (1.08, 1.35) | 1.35 (1.21, 1.50) | 1.21 (0.98, 1.49) | 1.14 (1.01, 1.29) | 1.12 (0.95, 1.32) | |
| User | 1.30 (1.17, 1.44) | 1.30 (1.19, 1.43) | 1.11 (1.02, 1.20) | 1.01 (0.92, 1.11) | 1.28 (1.17, 1.40) | 1.43 (1.30, 1.56) | 1.48 (1.26, 1.75) | 1.01 (0.91, 1.12) | 1.14 (0.99, 1.32) | |
| Alcohol intake,2 mL/wk | 0 | 1.00 | 1.00 | 1.00 | 1.00 | 1.00 | 1.00 | 1.00 | 1.00 | 1.00 |
| 0.2–24.9 | 1.21 (1.11, 1.31) | 1.10 (1.02, 1.19) | 1.04 (0.97, 1.12) | 1.02 (0.94, 1.10) | 1.13 (1.04, 1.23) | 1.23 (1.14, 1.33) | 1.03 (0.86, 1.23) | 1.19 (1.09, 1.30) | 1.25 (1.10, 1.42) | |
| 25.0–71.7 | 1.35 (1.24, 1.47) | 1.23 (1.14, 1.33) | 1.14 (1.05, 1.22) | 1.05 (0.97, 1.13) | 1.33 (1.23, 1.44) | 1.40 (1.30, 1.52) | 1.12 (0.94, 1.33) | 1.23 (1.13, 1.35) | 1.31 (1.15, 1.49) | |
| ≥71.7 | 1.41 (1.29, 1.54) | 1.30 (1.20, 1.41) | 1.15 (1.06, 1.24) | 1.05 (0.96, 1.13) | 1.44 (1.32, 1.56) | 1.46 (1.34, 1.58) | 1.26 (1.07, 1.50) | 1.35 (1.23, 1.48) | 1.39 (1.22, 1.59) | |
| Rank3 | Junior enlisted | 1.00 | 1.00 | 1.00 | 1.00 | 1.00 | 1.00 | 1.00 | 1.00 | 1.00 |
| Mid-enlisted | 1.05 (0.93, 1.18) | 1.10 (0.98, 1.24) | 1.10 (0.98, 1.23) | 0.91 (0.81, 1.03) | 1.12 (1.00, 1.27) | 1.02 (0.91, 1.15) | 1.19 (0.89, 1.60) | 0.95 (0.83, 1.10) | 1.23 (0.95, 1.59) | |
| Senior enlisted | 1.21 (1.03, 1.41) | 1.05 (0.91, 1.22) | 1.14 (0.99, 1.31) | 0.85 (0.73, 0.98) | 1.28 (1.10, 1.49) | 1.03 (0.89, 1.19) | 1.22 (0.87, 1.72) | 0.87 (0.73, 1.03) | 1.28 (0.96, 1.71) | |
| Warrant officer | 1.02 (0.80, 1.31) | 1.11 (0.88, 1.40) | 1.14 (0.92, 1.42) | 0.74 (0.59, 0.94) | 1.37 (1.08, 1.74) | 1.01 (0.81, 1.10) | 1.34 (0.85, 2.12) | 0.76 (0.58, 1.00) | 1.18 (0.80, 1.74) | |
| Junior officer | 1.30 (1.10, 1.53) | 1.07 (0.91, 1.24) | 1.16 (1.01, 1.35) | 0.81 (0.69, 0.94) | 1.46 (1.25, 1.70) | 0.94 (0.81, 1.10) | 0.67 (0.44, 1.00) | 0.90 (0.76, 1.08) | 1.32 (0.98, 1.78) | |
| Senior officer | 1.26 (1.06, 1.51) | 1.09 (0.92, 1.28) | 1.32 (1.13, 1.55) | 0.90 (0.76, 1.05) | 1.37 (1.15, 1.62) | 0.80 (0.68, 0.95) | 0.69 (0.46, 1.02) | 0.82 (0.68, 1.01) | 1.45 (1.07, 1.98) | |
| Military occupational specialty | CA | 1.00 | 1.00 | 1.00 | 1.00 | 1.00 | 1.00 | 1.00 | 1.00 | 1.00 |
| CS | 0.98 (0.91, 1.06) | 1.00 (0.93, 1.07) | 1.03 (0.96, 1.10) | 1.04 (0.96, 1.12) | 0.97 (0.90, 1.05) | 0.96 (0.90, 1.04) | 1.03 (0.88, 1.19) | 0.97 (0.89, 1.06) | 0.94 (0.84, 1.05) | |
| CSS | 0.97 (0.90, 1.05) | 0.95 (0.88, 1.02) | 0.97 (0.90, 1.04) | 1.05 (0.97, 1.13) | 0.88 (0.82, 0.95) | 0.96 (0.89, 1.04) | 0.97 (0.83, 1.14) | 0.98 (0.90, 1.06) | 0.79 (0.70, 0.89) | |
| Service branch | Air Force | 1.00 | 1.00 | 1.00 | 1.00 | 1.00 | 1.00 | 1.00 | 1.00 | 1.00 |
| Army | 0.95 (0.87, 1.03) | 1.07 (0.99, 1.15) | 0.88 (0.83, 0.95) | 0.96 (0.90, 1.05) | 0.96 (0.89, 1.03) | 1.11 (1.03, 1.19) | 1.60 (1.36, 1.89) | 1.10 (1.01, 1.19) | 1.02 (0.91, 1.14) | |
| Marine Corps | 1.04 (0.93, 1.15) | 1.26 (1.15, 1.39) | 0.91 (0.83, 1.00) | 0.92 (0.83, 1.02) | 1.23 (1.11, 1.36) | 1.21 (1.10, 1.33) | 1.60 (1.31, 1.96) | 1.11 (0.99, 1.24) | 1.12 (0.96, 1.31) | |
| Navy | 1.02 (0.93, 1.11) | 1.08 (0.99, 1.17) | 0.97 (0.90, 1.04) | 1.02 (0.95, 1.11) | 0.97 (0.90, 1.05) | 1.04 (0.96, 1.13) | 1.30 (1.08, 1.57) | 1.27 (1.16, 1.39) | 0.98 (0.87, 1.11) |
Values are OR (95% CI). Results are for the full model with all variables entered. CA, combat arms; CS, combat support; CSS, combat service support; DS, dietary supplement; Grad, graduate; HS, high school; Sep, wid, div, separated, widowed, divorced.
Alcohol consumption: 0.2–24.9 mL/wk = 0.0–1.4 standard drinks; 25.0–71.7 mL/wk = 1.4–4.0 standard drinks; ≥71.7 mL/wk = >4.0 standard drinks.
For rank: junior enlisted, E1–E4; mid-enlisted, E5–E6; senior enlisted, E7–E9; junior officer, O1–O3; senior officer, O4–O7.
Factors independently associated with use of any DS included female gender, older age, higher education level, higher BMI, less aerobic exercise, more resistance training, former smoking, current or former smokeless tobacco use, higher alcohol intake, and senior enlisted or officer status. Use of ≥5 DSs (≥1 time/wk) was independently associated with female gender, older age, higher education level, marriage or former marriage, higher BMI, less aerobic exercise, more resistance training, former smoking, current or former smokeless tobacco use, higher alcohol intake, and service in the Marine Corps. Factors independently associated with use of MVMs included female gender, older age, higher education level, higher BMI, more resistance training, never smoking, smokeless tobacco use, more alcohol intake, officer status, and service in the Air Force (compared with Army service). Use of individual vitamins/minerals was independently associated with female gender, older age, higher education level, separation/widowhood/divorce, higher BMI, more aerobic exercise, more resistance training, and lower rank.
Factors independently associated with use of proteins/AAs included male gender, younger age, higher education level, separation/widowhood/divorce, higher BMI, less aerobic exercise, more resistance training, former smoking, current or former smokeless tobacco use, higher alcohol intake, higher military rank, combat arms occupations (compared with combat service support), and service in the Marine Corps. Use of combination products was independently associated with having some college education, separation/widowhood/divorce, higher BMI, less aerobic training, more resistance training, current or former tobacco use, higher alcohol intake, junior enlisted status (compared with senior officers), and service in the Army or Marine Corps. Factors independently associated with the use of purported prohormones included male gender, older age, separation/widowhood/divorce, higher BMI, less aerobic training, more resistance training, current smokeless tobacco use, higher alcohol intake, and service in the Army, Marine Corps, or Navy (compared with the Air Force). Use of herbals was independently associated with female gender, older age, higher education level, higher BMI, more resistance training, former smokeless tobacco use, higher alcohol intake, and service in the Army or Navy (compared with the Air Force). Factors independently associated with use of joint health products included female gender, older age, higher education level, separation/widowhood/divorce, higher BMI, more resistance training, never smoking, higher alcohol intake, senior officer status, and combat arms occupation (compared with combat service support).
Survey responders and nonresponders (response bias)
Compared with the requested stratified sample, there were a larger proportion of Air Force responders (37%) and a lower proportion of responders from the other services (Army = 30%, Navy = 22%, Marine Corps = 12%), and there was a larger proportion of female responders (14%). Compared with nonresponders, responders were older (mean ± SD: 33 ± 8 y compared with 31 ± 7 y, P < 0.01), had more time in service (mean ± SD: 11 ± 7 y compared with 9 ± 7 y, P < 0.01), were more likely to be women (14% compared with 12%, P < 0.01), were more likely to have some college or higher education level (55% compared with 39%, P < 0.01), and were more likely to be officers (31% compared with 20%, P < 0.01). Of 10 occupational groups, those with the highest response rates were infantry (18%), support/administration (17%), mechanical maintenance (14%), electrical repair (12%), health care (12%), and communications/intelligence (11%).
Discussion
This study found that prevalence of DS use in the military services was high, with 74% of service members using ≥1 DS ≥1 time/wk and 40% of users consuming ≥5 DSs/wk. The most commonly used DSs were MVMs (45%), combination products (44%), proteins/AAs (42%), individual vitamins/minerals (31%), herbals (20%), joint health products (9%), and prohormones (5%). Factors independently associated with use of any DS included female gender, older age, higher education level, higher BMI, more resistance training, former smoking, current or former smokeless tobacco use, higher alcohol intake, and higher military rank (senior enlisted or officer). When individual supplements were examined, men were more likely to use proteins/AAs, combination products, and purported prohormones, whereas women were more likely to use MVMs, individual vitamins/minerals, herbals, and joint health products.
The different branches of service were generally surprisingly similar with respect to their use of most types of DSs. Marine Corps personnel were more likely to use proteins/AAs and combination products and less likely to use MVMs and individual vitamins and minerals. Several of these categories of DSs that are used much more frequently by service members than by civilians, specifically combination products and prohormones, are known to be more dangerous than DSs like multivitamins (23).
Prevalence and types of DSs used
In agreement with previous military studies (4–6, 16), service members used more DSs and had a considerably different pattern of DS use than civilians surveyed in the NHANES. This is shown in Figure 2 which compares NHANES data (7, 24) with those of the current study.
FIGURE 2.
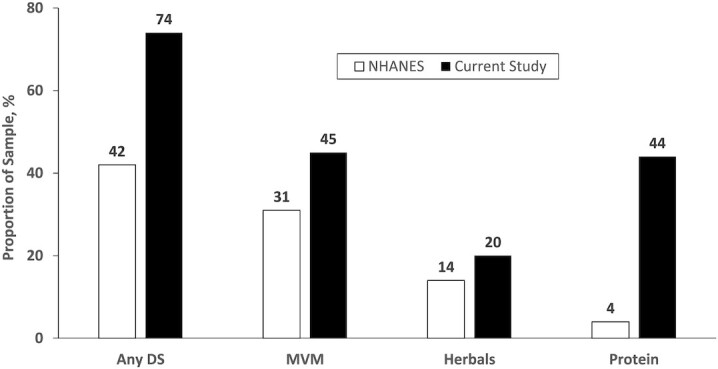
Comparison of NHANES data with those of the current investigation. DS, dietary supplement; MVM, multivitamin/multimineral.
Compared with the broader American population, service members had higher overall DS use and higher use in all comparable categories, especially proteins/AAs. However, there are limitations in comparing civilian and military data related to reporting time frame and sample age. The reporting time frame in the current study was use in the past 6 mo, whereas for the NHANES, it was use in the past 30 d. The NHANES population is older than the military population, and older adults tend to use more DSs than younger adults (24, 25).
The NHANES found DS use among Americans had increased from 23% in 1987 to 52% in 2011–2014 (3, 24, 23, 26). A previous study of Army personnel (19) found that from 2006 to 2011, use of any DS ≥1 time/wk increased from 56% to 64%. Supplemental Table 1 presents data from various military DS studies. Most of these investigations (4, 6, 16, 19) used similar surveys and asked about DS use in the past 6 mo; brand name DSs listed on the questionnaire were updated for DSs that were available on and near military installations when the studies were conducted. One study (5) included broad DS categories (i.e., no brand names) and asked about DS use in the past year. Despite these differences, the data in Supplemental Table 1 suggest, in consonance with previous civilian (3, 24, 23, 26) and military (19) data, that overall DS use is increasing over time in all branches of the military. The trends appear to differ depending on the DS category. Limited data suggest that use of MVMs and individual vitamins/minerals increased between 2006 and 2012, but the most recent data from the current study suggest a reduction in use in these categories. Use of proteins/AAs, combination products, herbals, and purported prohormones has increased dramatically among service members.
Combination products in the past have often contained substances like ephedra and 1,3-dimethylamylamine (DMAA) that are now banned in the United States (27, 28). Before the ban on DMAA, 1 study found that 11% of service members were using DSs labeled as containing DMAA, and regular users (≥1 time/wk) were 2 to >3 times more likely to report adverse effects (AEs) (29). Another study found that military users of combination products of any type were 2–3.5 times more likely to report a variety of AEs (e.g., abnormal heartbeats, stomach pain, dizziness), whereas prohormone users were >2.5 times more likely to report dizziness (30). Because combination products and purported prohormones had a high incidence of self-reported AEs (4), this is an area of concern.
Proteins/AAs and combination products are often consumed in conjunction with resistance exercise to purportedly assist in building muscle strength or muscle mass (31) and/or assist in postexercise recovery (32). We hypothesized that increased use of these DSs might be associated with higher levels of resistance training, but this was not the case. In a previous study, Navy and Marine protein/AA or combination product users engaged in a mean ± SD of 280 ± 307 min/wk of resistance training (4), whereas in the present study, this figure was 275 ± 291 min/wk.
Factors associated with DS use
The NHANES (2, 3, 7, 24, 26, 33, 34), National Health Interview Survey (23, 35, 36), and previous military studies (4–6, 16, 17, 37) reported women had higher overall use of DSs, in agreement with both the univariate and multivariable results of the present study. Specifically, women used more MVMs, individual vitamins/minerals, herbals, and joint health products than men. Sex differences may be associated with greater overall health awareness in women, as evidenced by the fact that women are more likely to seek medical care (38–40) and are more likely than men to make behavioral changes to improve health (41–43). Although women had higher use than men in most DS categories, men had higher use of proteins/AAs, combination products, and purported prohormones. This may be because physically active men are more interested in developing strength and muscle mass (44–46) and investigations show physical training with consumption of proteins/AAs will improve these factors (31). Many combination products and purported prohormones are marketed for similar reasons, and they have a high incidence of self-reported AEs (4). Use of these substances may be associated with a greater propensity for men to engage in risky health behaviors than women (47–50).
Similar to findings with regard to DS use and sex, previous civilian (3, 24, 23, 33, 51, 52) and military (4–6, 16, 19) studies have generally found that higher education levels are associated with higher overall DS use. The current investigation also observed this association in univariate and multivariable analysis, especially among users of MVMs, individual vitamins/minerals, herbals, and joint health products. Individuals who have achieved higher education levels are generally more proactive, more health conscious, more prone to engage in health-promoting behaviors, and more likely to explore multiple channels of information related to their health (53–57), which may lead to higher use of some types of DSs (58–60).
Whereas civilian studies have consistently shown use of any DS (2, 3, 7, 24, 26, 33, 34, 61) and use of MVMs (2, 7, 24, 23, 34, 52) increase with age in adults, this association appears more complex among military personnel. In the present study, overall DS use was lowest in the youngest (18–24 y) age group and changed only modestly in older age groups. Analysis of the present and previous studies (4–6, 16, 19) suggested this was largely because of the types of DSs used. In univariate analysis, use of MVMs, individual vitamins/minerals, purported prohormones, herbals, and joint health products increased with age, whereas use of proteins/AAs and combination products generally had the highest use prevalence in younger age groups. Thus, whereas use of certain categories of DSs increases with age, other categories have high use among younger service members, resulting in the trend seen in overall usage. In multivariable analysis, most of these relations were maintained, but age was not independently associated with combination product use, although the trend was in the expected direction.
Whereas civilian studies (2, 3, 24, 26, 36) have shown virtually no association between BMI and DS use, military studies (4, 5, 16, 19) are generally consistent in showing that overall use of DSs increases as BMI increases. Among service members in the current and past studies (4, 16), the strongest associations in both univariate and multivariable analyses have been between BMI and combination product use. Many combination products are alleged to assist in weight or fat loss. Studies (5, 62, 63) that specifically examined weight loss supplements in military populations showed a 3.2- to 3.8-fold increase in weight loss supplement use comparing service members with normal BMIs (<25) and those with obese BMIs (≥30). Military service regulations describe strict weight for height and body fat standards required to continue military service (64–67). Individuals who do not meet these standards receive adverse performance reports and can be discharged from service for repeated failures to achieve the standards. This may prompt some individuals who have difficulty meeting these requirements to use DSs marketed for weight or body fat loss.
Higher amounts of exercise or physical activity have been associated with higher DS use in both civilian (2, 26, 68) and military investigations (5, 6, 17, 62) or showed trends in this direction (4, 16, 34). In the current study, the use of DSs in all categories generally increased as physical activity increased. In multivariable analysis, the relation between aerobic training and DS use was considerably reduced because of the much larger association between resistance training and DS use. As aerobic training time increased so did resistance training time, and the correlation between these variables was 0.61. Individuals who have higher levels of physical activity tend to have other favorable health habits (69–71) and may perceive certain DSs to be an additional way to improve their health and performance. In the present study, it was notable that there was an ∼3-fold increase in protein/AA and combination product use among the most active resistance training service members compared with the least active resistance trainers. Pre- and postexercise use of proteins/AAs has been shown to increase muscle mass and strength (31), and many combination products are promoted for increasing strength and muscle mass and for their ergogenic effects (72, 73), which likely encourages more active service members to use them.
Tobacco use and excessive alcohol consumption are risky health behaviors because of their associations with chronic diseases, mortality, and injuries (74–76). Combination products and purported prohomones are those with the highest risk of AEs (4), and the association between these 2 categories of DSs and tobacco/alcohol use was graded. That is, smokers and smokeless tobacco users had the highest use of these substances, those who had never smoked had the least, and those who had quit were intermediate between these 2; use of these DSs increased as alcohol consumption increased. The only study (62) examining the relation between DS use and these lifestyle factors in military personnel found that use of body-building, weight-loss, and performance-enhancing DSs increased as alcohol consumption increased. Previous civilian studies found no consistent relation (2, 24, 26, 34), and the reasons for the differences between military and civilian populations are not clear.
Strengths and limitations
The current study had the advantage of recruiting a large, stratified, random sample of service members from all branches of service. The questionnaire was standardized and based on questionnaires used in previous military studies (18). The demographics and lifestyle factors examined were similar to those of other civilian and military investigations, which allowed for satisfactory comparisons among studies. However, the service members who volunteered differed somewhat from the desired stratified sample, although both sexes and all service branches were well represented. The 18% response rate was relatively low, but close to the 20% response rate expected for military survey studies conducted by the NHRC that investigate topics other than DSs. Although the questionnaire instructions and consent form emphasized the importance of both DS user and nonuser participation, it is possible the questionnaire may have attracted more DS users. All data were self-reported and had the usual weaknesses associated with this method, including recall bias, social desirability, errors in self-observation, and inadequate recall (77, 78).
Conclusions
In the current study using a stratified random sample of >26,000 service members, 74% reported DS use, with the highest use for MVMs (45%), combination products (44%), and proteins/AAs (42%). As the volume of resistance training increased, DS use in all categories increased, especially for proteins/AAs and combination products. Compared with the civilian data assessed in the NHANES, service members were much more likely to use DSs and to use different types of DSs, especially combination products and proteins/AAs. Comparisons with previous military data suggested DS use has increased over time among service members in all service branches, especially use of proteins/AAs, combination products, herbals, and purported prohormones. This article provides basic information on the current prevalence of DS use by military personnel and how demographic, lifestyle, and military factors affect use. The Institute of Medicine report on DS use in the military (15) suggested that conducting ongoing surveillance of DS use in the military was essential for protecting the health of service members.
Supplementary Material
Acknowledgments
We thank Ms. Patricia Bremner for assistance in obtaining references and Ms. Lauren Thompson for editorial comments. The authors’ responsibilities were as follows—JJK, DWT, EKF, and HRL: designed the research; JJK and RAS: analyzed the data; JJK: wrote the paper; DWT: conducted the research and provided essential material including the survey data; and all authors: had responsibility for the final content and read and approved the final manuscript.
Notes
Supported by the Department of Defense Center Alliance for Nutrition and Dietary Supplements Research, Defense Medical Research and Development Program (to HRL).
Author disclosures: The authors report no conflicts of interest.
We are military service members or employees of the US Government. This work was prepared as part of our official duties. Title 17, USC §105 provides that copyright protection under this title is not available for any work of the US Government. Title 17, USC §101 defines a US Government work as work prepared by a military service member or employee of the US Government as part of that person's official duties. Report No. 20-104 was supported by the Defense Health Program under work unit no. N1335. The views expressed in this article are those of the authors and do not necessarily reflect the official policy or position of the Department of the Navy, Department of Defense, nor the US Government. The study protocol was approved by the Naval Health Research Center (NHRC) Institutional Review Board in compliance with all applicable Federal regulations governing the protection of human subjects. Research data were derived from an approved NHRC Institutional Review Board protocol, number NHRC.2016.0025.
Supplemental Table 1 is available from the “Supplementary data” link in the online posting of the article and from the same link in the online table of contents at https://academic.oup.com/jn.
Abbreviations used: AA, amino acid; AE, adverse effect; DMAA, 1,3-dimethylamylamine; DMDC, Defense Manpower Data Center; DS, dietary supplement; DSHEA, Dietary Supplement Health and Education Act of 1994; MVM, multivitamin/multimineral; NHRC, Naval Health Research Center.
Contributor Information
Joseph J Knapik, Military Nutrition Division, US Army Research Institute of Environmental Medicine, Natick, MA, USA.
Daniel W Trone, Deployment Health Research Department, Naval Health Research Center, San Diego, CA, USA.
Ryan A Steelman, Army Public Health Center, Aberdeen Proving Ground, MD, USA.
Emily K Farina, Military Nutrition Division, US Army Research Institute of Environmental Medicine, Natick, MA, USA.
Harris R Lieberman, Military Nutrition Division, US Army Research Institute of Environmental Medicine, Natick, MA, USA.
References
- 1. FDA. Dietary Supplement Health and Education Act of 1994. Public Law 103-417, 103rd Congress[Internet]. 1994.; Bethesda, MD: NIH Office of Dietary Supplements; [cited 14 July, 2020]. Available from: https://ods.od.nih.gov/About/dshea_Wording.aspx. [Google Scholar]
- 2. Radimer K, Bindewald B, Hughes J, Ervin B, Swanson C, Picciano MF. Dietary supplement use by US adults: data from the National Health and Nutrition Examination Survey, 1999–2000. Am J Epidemiol. 2004;160(4):339–49. [DOI] [PubMed] [Google Scholar]
- 3. Kennedy ET, Luo H, Houser RF. Dietary supplement use pattern of U.S. adult population in the 2007–2008 National Health and Nutrition Examination Survey (NHANES). Ecol Food Nutr. 2013;52:76–84. [DOI] [PubMed] [Google Scholar]
- 4. Knapik JJ, Trone DW, Austin KG, Steelman RA, Farina EK, Lieberman HR. Prevalence, adverse effects, and factors associated with dietary supplement and nutritional supplement use by United States Navy and Marine Corps personnel. J Acad Nutr Diet. 2016;116(9):1423–42. [DOI] [PubMed] [Google Scholar]
- 5. Knapik JJ, Austin KG, Farina EK, Lieberman HR. Dietary supplement use in a large, representative sample of the United States Armed Forces. J Acad Nutr Diet. 2018;118(8):1370–88. [DOI] [PubMed] [Google Scholar]
- 6. Austin KG, Price LL, McGraw SM, Leahy G, Lieberman HR. Demographic, lifestyle factors and reasons for use of dietary supplements by Air Force personnel. Aerosp Med Human Perform. 2016;87(7):628–37. [DOI] [PubMed] [Google Scholar]
- 7. Bailey RL, Gahche JJ, Lentino CV, Dwyer JT, Engel JS, Thomas PR, Betz JM, Sempos CT, Picciano MF. Dietary supplement use in the United States, 2003–2006. J Nutr. 2011;141:261–6. [DOI] [PMC free article] [PubMed] [Google Scholar]
- 8. Saldanha LG. The dietary supplement marketplace. Constantly evolving. Nutr Today. 2007:42(2):52–4. [Google Scholar]
- 9. NewHope. 2019 Supplement Business Report. [Internet]. London, United Kingdom: Informa; 2019; [cited 1 June, 2020]. Available from: https://store.newhope.com/products/2019-supplement. [Google Scholar]
- 10. Smith T, Kawa K, Eckl V, Morton C, Stredney R. Herbal supplement sales in US increased 8.5% in 2017, topping $8 billion. [Internet]. Herbalgram. 2018;(119):62–71 .[cited 1 June 2020]. Available from: http://herbalgram.org/resources/herbalgram/issues/119/table-of-contents/hg119-herbmktrpt/. [Google Scholar]
- 11. Sridhar A, Duester PA, Becker WJ, Coll R, O'Brien KK, Bathalon G. Health assessment of U.S. Army Rangers. Mil Med. 2003;168(1):57–62. [PubMed] [Google Scholar]
- 12. Bovill ME, Tharion WJ, Lieberman HR. Nutrition knowledge and supplement use among elite U.S. army soldiers. Mil Med. 2003;168(12):997–1000. [PubMed] [Google Scholar]
- 13. Brasfield K. Dietary supplement intake in the active duty enlisted population. US Army Med Dep J. 2004:44–56. [Google Scholar]
- 14. Arsenault J, Kennedy J. Dietary supplement use in U.S. Army Special Operations candidates. Mil Med. 1999;164(7):495–501. [PubMed] [Google Scholar]
- 15. Greenwood MRC, Oria Meditors. Use of dietary supplements by military personnel [Internet]. Washington (DC): The National Academies Press; 2008. [cited 23 April, 2021]. Available from: http://www.nap.edu/catalog/12095.html. [PubMed] [Google Scholar]
- 16. Lieberman HR, Stavinoha TB, McGraw SM, White A, Hadden LS, Marriott BP. Use of dietary supplements among active-duty US Army soldiers. Am J Clin Nutr. 2010;92(4):985–95. [DOI] [PubMed] [Google Scholar]
- 17. Austin KG, Price LL, McGraw SM, Lieberman HR. Predictors of dietary supplement use by US Coast Guard personnel. PLoS One. 2015;10(7):e0133006. [DOI] [PMC free article] [PubMed] [Google Scholar]
- 18. Caldwell JA, McGraw SM, Thompson LA, Lieberman HR. A survey instrument to assess intake of dietary supplements, related products, and caffeine in high-use populations. J Nutr. 2018;148(suppl_2):1445S–51S. [DOI] [PubMed] [Google Scholar]
- 19. Austin KG, Price LL, McGraw SM, Lieberman HR. Longitudinal trends in use of dietary supplements by US Army personnel differ from those of civilians. Appl Physiol Nutr Metab. 2016;41:1217–24. [DOI] [PubMed] [Google Scholar]
- 20. Edwards P, Cooper R, Roberts I, Frost C. Meta-analysis of randomized trials of monetary incentives and response to mailed questionnaires. J Epidemiol Community Health. 2005;59:987–99. [DOI] [PMC free article] [PubMed] [Google Scholar]
- 21. Church AH. Estimating the effect of incentives on mail survey response rates: a meta-analysis. Public Opin Q. 1993;57:62–79. [Google Scholar]
- 22. NIH. What is a standard drink? [Internet]. Bethesda, MD: National Institute on Alcohol Abuse and Alcoholism; 2021. [cited 21 May, 2021]. Available from: https://www.niaaa.nih.gov/what-standard-drink. [Google Scholar]
- 23. Millen AE, Dodd KW, Subar AF. Use of vitamin, mineral nonvitamin and nonmineral supplements in the United States: the 1987, 1992 and 2000 National Health Interview Survey results. J Am Diet Assoc. 2004;104:942–50. [DOI] [PubMed] [Google Scholar]
- 24. Cowan AE, Jun S, Gahche JJ, Tooze JA, Dwyer JT, Eicher-Miller HA, Bhadra A, Guenther PM, Potischman N, Dodd KWet al. Dietary supplement use differs by socioeconomic and health-related characteristics among U.S. adults, NHANES 2011–2014. Nutrients. 2018;10:1114. [DOI] [PMC free article] [PubMed] [Google Scholar]
- 25. Blumberg JB, Frei B, Fulgoni VL, Weaver CM, Zeisel SH. Contribution of dietary supplements to nutritional adequacy in various adult age groups. Nutrients. 2017;9:1325. [DOI] [PMC free article] [PubMed] [Google Scholar]
- 26. Bailey RL, Gahche JJ, Miller PE, Thomas PR, Dwyer JT. Why US adults use dietary supplements. JAMA Intern Med. 2013;173(3):355–61. [DOI] [PubMed] [Google Scholar]
- 27. FDA. DMAA in dietary supplements [Internet]. Silver Spring, MD: FDA; 2013. [cited 24 November, 2020]. Available from: https://wayback.archive-it.org/7993/20170722025648/https://www.fda.gov/Food/DietarySupplements/ProductsIngredients/ucm346576.htm. [Google Scholar]
- 28. FDA. Ephedra[Internet]. Silver Spring, MD: FDA; 2004[cited 25 November, 2020]. Available from: https://ods.od.nih.gov/HealthInformation/Ephedra.aspx. [Google Scholar]
- 29. Lieberman HR, Austin KG, Farina EK. Surveillance of the Armed Forces as a sentinel system for detecting adverse effects of dietary supplements in the general population. Public Health Nutr. 2018;21(5):882–7. [DOI] [PMC free article] [PubMed] [Google Scholar]
- 30. Austin KG, Farina EK, Lieberman HR. Self-reported side-effects associated with the use of dietary supplements in an Armed Forces population. Drug Test Anal. 2016;8(3–4):287–95. [DOI] [PMC free article] [PubMed] [Google Scholar]
- 31. Cermak NM, Res PT, de Groot LCPGM, Saris WHM, van Loon LJC. Protein supplementation augments the adaptive response of skeletal muscle to resistance-type exercise training: a meta-analysis. Am J Clin Nutr. 2012;96:1454–64. [DOI] [PubMed] [Google Scholar]
- 32. Davies RW, Carson BP, Jakeman PM. The effect of whey protein supplementation on the temporal recovery of muscle function following resistance training: a systematic review and meta-analysis. Nutrients. 2018;10:221. [DOI] [PMC free article] [PubMed] [Google Scholar]
- 33. Kantor ED, Rehm CD, Du M, White E, Giovannucci EL. Trends in dietary supplement use among US adults from 1999-2012. JAMA. 2016;316(14):1464–74. [DOI] [PMC free article] [PubMed] [Google Scholar]
- 34. Block G, Cox C, Madans J, Schreiber GB, Melia N. Vitamin supplement use, by demographic characteristics. Am J Epidemiol. 1988;127(2):297–309. [DOI] [PubMed] [Google Scholar]
- 35. Slesinski MJ, Subar AF, Kahle LL. Trends in the use of vitamin and mineral supplements in the United States: the 1987 and 1992 National Health Interview Surveys. J Am Diet Assoc. 1995;95(8):921–3. [DOI] [PubMed] [Google Scholar]
- 36. Subar AF, Block G. Use of vitamin and mineral supplements: demographics and amount of nutrients consumed. Am J Epidemiol. 1990;132(6):1091–101. [DOI] [PubMed] [Google Scholar]
- 37. Knapik JJ, Steelman R, Hoedebecke S, Farina E, Austin K, Lieberman HR. A systematic review and meta-analysis on the prevalence of dietary supplement use by military personnel. BMC Complement Altern Med. 2014;14:143. [DOI] [PMC free article] [PubMed] [Google Scholar]
- 38. Owens GM. Gender differences in health care expenditures, resource utilization, and quality of care. J Manag Care Pharm. 2008;14(3 Supp A):S2–S6. [DOI] [PMC free article] [PubMed] [Google Scholar]
- 39. Muller C. Review of twenty years of research on medical care utilization. Health Serv Res. 1986;21(2 Pt 1):129–44. [PMC free article] [PubMed] [Google Scholar]
- 40. Ladwig KH, Marten-Mittag B, Formanek B, Dammann G. Gender differences in symptom reporting and medical care utilization in the German population. Eur J Epidemiol. 2000;16:511–18. [DOI] [PubMed] [Google Scholar]
- 41. Alley ES, Velasquez MM, von Sternberg K. Associated factors of readiness to change in young adult risky drinkers. Am J Drug Alcohol Abuse. 2018;44(3):348–57. [DOI] [PubMed] [Google Scholar]
- 42. Ennis E, McLafferty M, Murray E, Lapsley C, Bjourson T, Armour C, Murphy S, O'Neill S. Readiness to change and barriers to treatment in college students with a mental disorder. J Affect Disord. 2019:252:428–34. [DOI] [PubMed] [Google Scholar]
- 43. Street TD, Lacey SJ. Employee characteristics and health belief variables related to smoking cessation engagement attitudes. Work. 2018;60:75–83. [DOI] [PubMed] [Google Scholar]
- 44. Kristiansen M, Levy-Milne R, Barr S, Flint A. Dietary supplement use by varsity athletes at a Canadian university. Int J Sport Nutr Exerc Metab. 2005;15:195–210. [DOI] [PubMed] [Google Scholar]
- 45. Erdman KA, Fung TS, Doyle-Baker PK, Verhoef MJ, Reimer RA. Dietary supplementation of high-performance Canadian athletes by age and gender. Clin J Sport Med. 2007;17(6):458–64. [DOI] [PubMed] [Google Scholar]
- 46. Kim J, Chun YS, Kang SK, Cho HC. The use of herbal/traditional products supplementation and doping tests in elite athletes. Int J Appl Sports Sci. 2010;22(2):137–49. [Google Scholar]
- 47. Zuckerman M, Kuhlman DM. Personality and risk taking: common biosocial factors. J Pers. 2000;68:999–1029. [DOI] [PubMed] [Google Scholar]
- 48. Cross CP, Cyrenne DLM, Brown GR. Sex differences in sensation-seeking: a meta-analysis. Sci Rep. 2013;3:2486. [DOI] [PMC free article] [PubMed] [Google Scholar]
- 49. Tonetti L, Adan A, Caci H, De Pascalis V, Fabbri M, Natale V. Morning-eveningness preference and sensation seeking. Eur Psychiatry. 2010;25:111–15. [DOI] [PubMed] [Google Scholar]
- 50. Fattore L, Melis M. Sex differences in impulsive and compulsive behaviors: a focus on drug addiction. Addict Biol. 2016;21:1043–51. [DOI] [PubMed] [Google Scholar]
- 51. Timbo BB, Ross MP, McCarthy PV, Lin CTJ. Dietary supplements in a national survey: prevalence of use and reports of adverse events. J Am Diet Assoc. 2006;106:1966–74. [DOI] [PubMed] [Google Scholar]
- 52. Koplan JP, Annest JL, Layde PM, Rubin GL. Nutrient intake and supplementation in the United States (NHANES II). Am J Public Health. 1986;76(3):287–9. [DOI] [PMC free article] [PubMed] [Google Scholar]
- 53. Ouwehand C, de Ridder DTD, Bensing JM. Who can afford to look to the future? The relationship between socio-economic status and proactive coping. Eur J Public Health. 2009;19(4):412–17. [DOI] [PubMed] [Google Scholar]
- 54. Harper S, Lynch J. Trends in socioeconomic inequalities in adult health behaviors among U.S. states, 1990–2004. Public Health Rep. 2007;122:177–89. [DOI] [PMC free article] [PubMed] [Google Scholar]
- 55. Iversen AC, Kraft P. Does socioeconomic status and health consciousness influence how women respond to health related messages in media?. Health Educ Res. 2006;21(5):601–10. [DOI] [PubMed] [Google Scholar]
- 56. Kim K-H, Shin HR, Nakama H. Health consciousness in relation to education in Korea—focusing on seven preventable risk factors. Asia Pac J Public Health. 1994;7(1):3–9. [DOI] [PubMed] [Google Scholar]
- 57. Dutta-Bergman MJ. The readership of health magazines: the role of health orientation. Health Mark Q. 2004;22(2):27–49. [PubMed] [Google Scholar]
- 58. Khorsan R, Crawford C, Ives JA, Walter AR, Jonas WB. The effect of omega-3 fatty acids on biomarkers of inflammation: a rapid evidence assessment of the literature. Mil Med. 2014;179:2–60. [DOI] [PubMed] [Google Scholar]
- 59. DiNicolantonio JJ, Niazi AK, McCarty MF, O'Keefe JH, Meier P, Lavie CJ. Omega-3s and cardiovascular health. Ochsner J. 2014;14:399–412. [PMC free article] [PubMed] [Google Scholar]
- 60. Hibbeln CR, Gow RV. The potential for military diets to reduce depression, suicide, and impulsive aggression: a review of current evidence for omega-3 and omega-6 fatty acids. Mil Med. 2014;179:117–28. [DOI] [PubMed] [Google Scholar]
- 61. Ervin RB, Wright JD, Reed-Gillette D. Prevalence of leading types of dietary supplements used in the third National Health and Nutrition Examination Survey, 1988–94. Adv Data. 2004;(349):1–7. [PubMed] [Google Scholar]
- 62. Kao T-C, Deuster PA, Burnett D, Stevens M. Health behaviors associated with use of body building, weight loss, and performance enhancing supplements. Ann Epidemiol. 2012;22:311–39. [DOI] [PubMed] [Google Scholar]
- 63. Jacobson IG, Horton JL, Smith B, Wells TS, Boyko EJ, Lieberman HR, Ryan MAK, Smith TC. Bodybuilding, energy, and weight loss supplements are associated with deployment and physical activity in US military personnel. Ann Epidemiol. 2012;22(5):318–30. [DOI] [PubMed] [Google Scholar]
- 64. US Air Force. Fitness Program, Air Force Instruction 36-2905, Change 1, 27 August 2015. Washington (DC): US Air Force; 2013. [Google Scholar]
- 65. US Marine Corps. U.S. Marine Corps Body Composition and Military Appearance Program, Marine Corps Order 6110.3 Corps, Headquarters, United States Marine Corps. Washington (DC): US Marine Corps; 2016. [Google Scholar]
- 66. US Navy. Physical Readiness Program, OPNAV Instruction 6110.1J. Washington (DC): Department of the Navy; 2011. [Google Scholar]
- 67. US Army. The Army Body Composition Program. Army Regulation 600-9. Headquarters, Department of the Army. Washington (DC): US Army; 2019. [Google Scholar]
- 68. Balluz LS, Okoro CA, Bowman BA, Serdula MK, Mokdad AH. Vitamin or supplement use among adults, Behavioral Risk Factor Surveillance System, 13 states, 2001. Public Health Rep. 2005;120:117–23. [DOI] [PMC free article] [PubMed] [Google Scholar]
- 69. Pate RR, Trost SG, Levin S, Dowda M. Sports participation and health-related behaviors among US youth. Arch Pediatr Adolesc Med. 2000;154(9):904–11. [DOI] [PubMed] [Google Scholar]
- 70. Steptoe A, Wardle J, Fuller R, Holte A, Justo J, Sanderman R, Wichstrøm L. Leisure-time physical exercise: prevalence, attitudinal correlates and behavioral correlates among young Europeans from 21 countries. Prev Med. 1997;26:845–54. [DOI] [PubMed] [Google Scholar]
- 71. Pate RR, Heath GW, Dowda M, Trost SG. Associations between physical activity and other health behaviors in a representative sample of US adolescents. Am J Public Health. 1996;86:1577–81. [DOI] [PMC free article] [PubMed] [Google Scholar]
- 72. Naderi A, Earnest CP, Lowery RP, Wilson JM, Willems MET. Co-ingestion of nutritional ergonomic aids and high intensity exercise performance. Sports Med. 2016;46(10):1407–18. [DOI] [PubMed] [Google Scholar]
- 73. Harty PS, Zabriskie HA, Erickson JL, Molling PE, Kerksick CM, Jagim AR. Multi-ingredient pre-workout supplements, safety implications, and performance outcomes: a brief review. J Int Soc Sports Nutr. 2018;15:41. [DOI] [PMC free article] [PubMed] [Google Scholar]
- 74. Belloc NB, Breslow L. Relationship of physical health status and health practices. Prev Med. 1972;1:409–21. [DOI] [PubMed] [Google Scholar]
- 75. Meng L, Maskarinec G, Lee J, Kolonel LN. Lifestyle factors and chronic diseases: application of a composite risk index. Prev Med. 1999;29:296–304. [DOI] [PubMed] [Google Scholar]
- 76. Ferrari P, Kicaj I, Andersen PK, Johansson M, Boeing H, Weiderpass E, Dossus L, Dartois L, Fagherazzi G, Bradbury KEet al. Lifetime alcohol use and overall and cause-specific mortality in the European Prospective Investigation into Cancer and nutrition (EPIC) study. BMJ Open. 2014;4:e005245. [DOI] [PMC free article] [PubMed] [Google Scholar]
- 77. Podsakoff PM, MacKenzie SB, Lee J-Y, Podsakoff NP. Common method biases in behavioral research: a critical review of the literature and recommended remedies. J Appl Psychol. 2003;88(5):879–903. [DOI] [PubMed] [Google Scholar]
- 78. Furnham A. Response bias, social desirability and dissimulation. Pers Individ Diff. 1986;7(3):385–400. [Google Scholar]
Associated Data
This section collects any data citations, data availability statements, or supplementary materials included in this article.