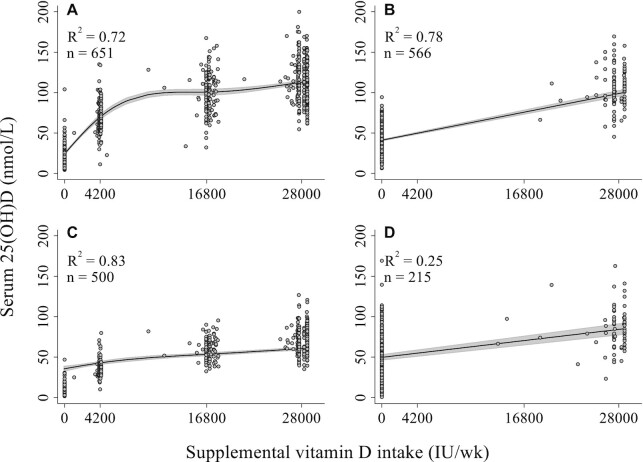
FIGURE 1.
Scatter plots with fitted regression lines of the associations of calculated vitamin D dose per week with serum 25(OH)D at delivery. Variation in supplemental intake was captured by the verified vitamin D composition for each lot of tablets and individual participant adherence with the intervention. (A) Relation between attained maternal 25(OH)D concentrations at delivery and maternal prenatal supplemental vitamin D intake adjusting for maternal 25(OH)D concentrations at enrollment, modeled as a restricted cubic spline. (B) Relation between attained maternal 25(OH)D concentrations at 6 mo postpartum and maternal postpartum supplemental vitamin D intake adjusting for maternal delivery 25(OH)D concentrations, modeled as a linear function. (C) Relation between neonatal (umbilical cord) 25(OH)D concentrations and maternal prenatal supplemental vitamin D intake adjusting for maternal delivery 25(OH)D concentrations, modeled as a restricted cubic spline. (D) Relation between attained infant 25(OH)D concentrations at 6 mo of age and maternal postpartum supplemental vitamin D intake adjusting for umbilical cord 25(OH)D concentrations, modeled as a linear function. Owing to observed heteroskedasticity, robust SEs were estimated in all regression models for assessment of variation in 25(OH)D in response to vitamin D supplementation (Tables 2–5). 25(OH)D, 25-hydroxyvitamin D.

