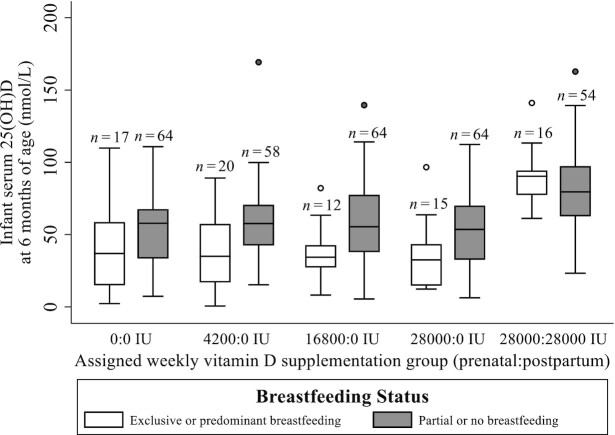
FIGURE 3.
Comparison of infant 25(OH)D concentrations across treatment groups, and differentiated by breastfeeding pattern at 6 mo of age. Central line shows group median; lower and upper edges of the box denote 1st and 3rd quartile, respectively; lower and upper whiskers denote the lowest and highest values observed within 1.5 × IQR, respectively; outliers are represented by open (exclusive/predominant breastfeeding) and shaded (partial or no breastfeeding) dots. Placebo group is represented by 0:0 IU. P = 0.007 for interaction of breastfeeding pattern and vitamin D intake (as continuous variable) on infant 25(OH)D (multivariable Model D). 25(OH)D, 25-hydroxyvitamin D.

