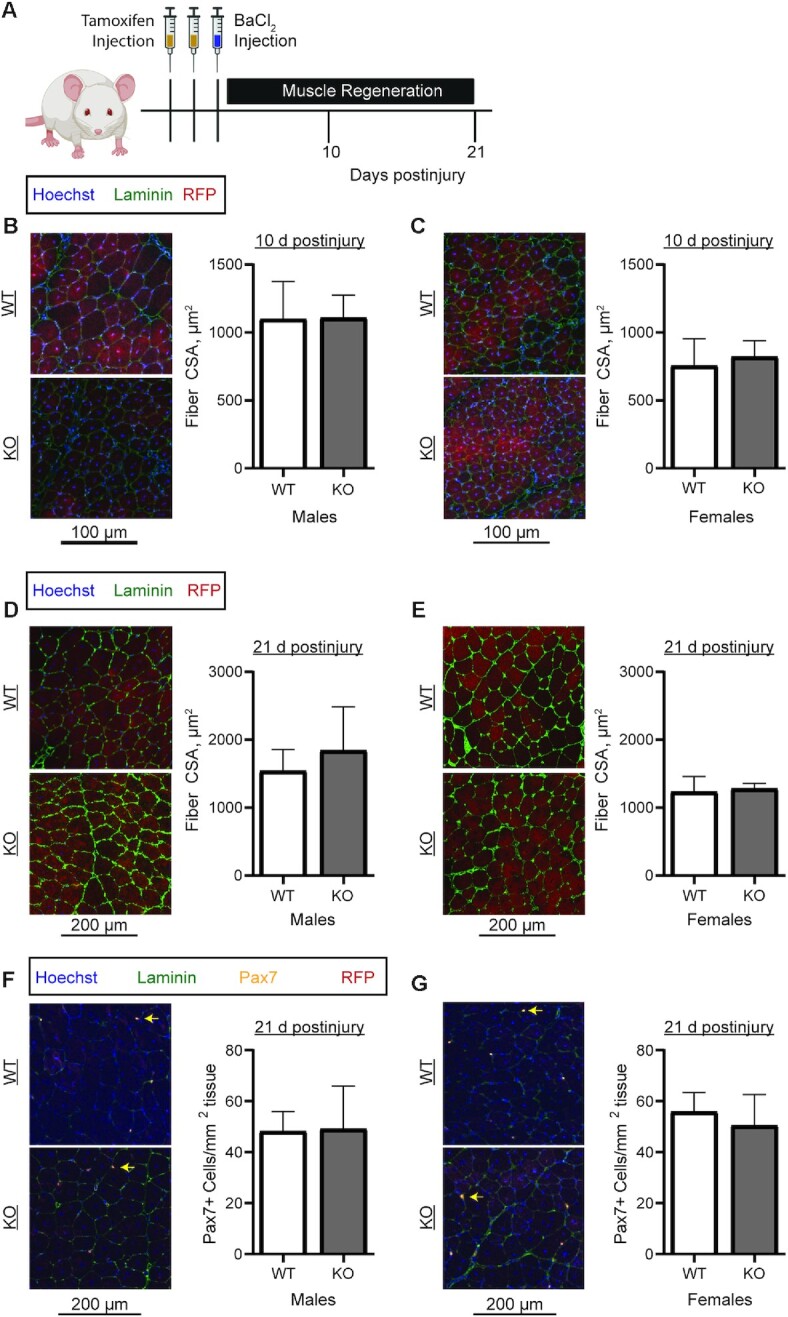
FIGURE 7.

Assessment of regenerative capacity in WT and PKM2 KO mice. (A) Eight-week-old mice were injected twice with tamoxifen on 2 consecutive days and with barium chloride on the third day. Mice were killed at 10 and 21 d postinjury. (B, C) Mean myofiber CSA at 10 d postinjury in (B) male (n = 5/genotype) and (C) female (WT, n = 6; KO, n = 4) WT and KO mice. (D, E) Mean myofiber CSA at 21 d postinjury in (D) male (n = 5/genotype) and (E) female (WT, n = 6; KO, n = 4) WT and KO mice. (F, G) Pax7+ cell number at 21 d postinjury in (F) male (n = 5/genotype) and (G) female (WT, n = 6; KO, n = 4) WT and KO mice. Yellow arrows show Pax7+ cells. Values are mean ± SD. CSA, cross-sectional area; KO, knockout; Pax7, paired box 7; RFP, red fluorescent protein; WT, wild-type.
