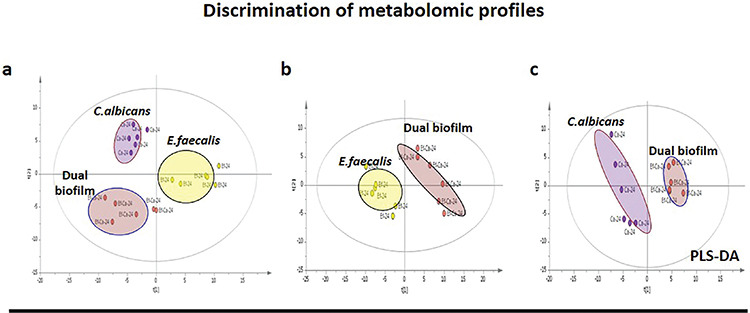
Figure 3.

a) PLS-DA score graphs of single- and dual-species biofilm of Candida albicans for metabolomic profile comparison. b) PLS-DA score plots show clear separation between Enterococcus faecalis and its dual-species biofilm. c) PLS-DA score plots demonstrate apparent distinction with C. albicans and its dual-species biofilm. Each circle represents the sharp metabolomic distinction in the biofilms
PLS-DA: Partial least squares discriminant analysis
