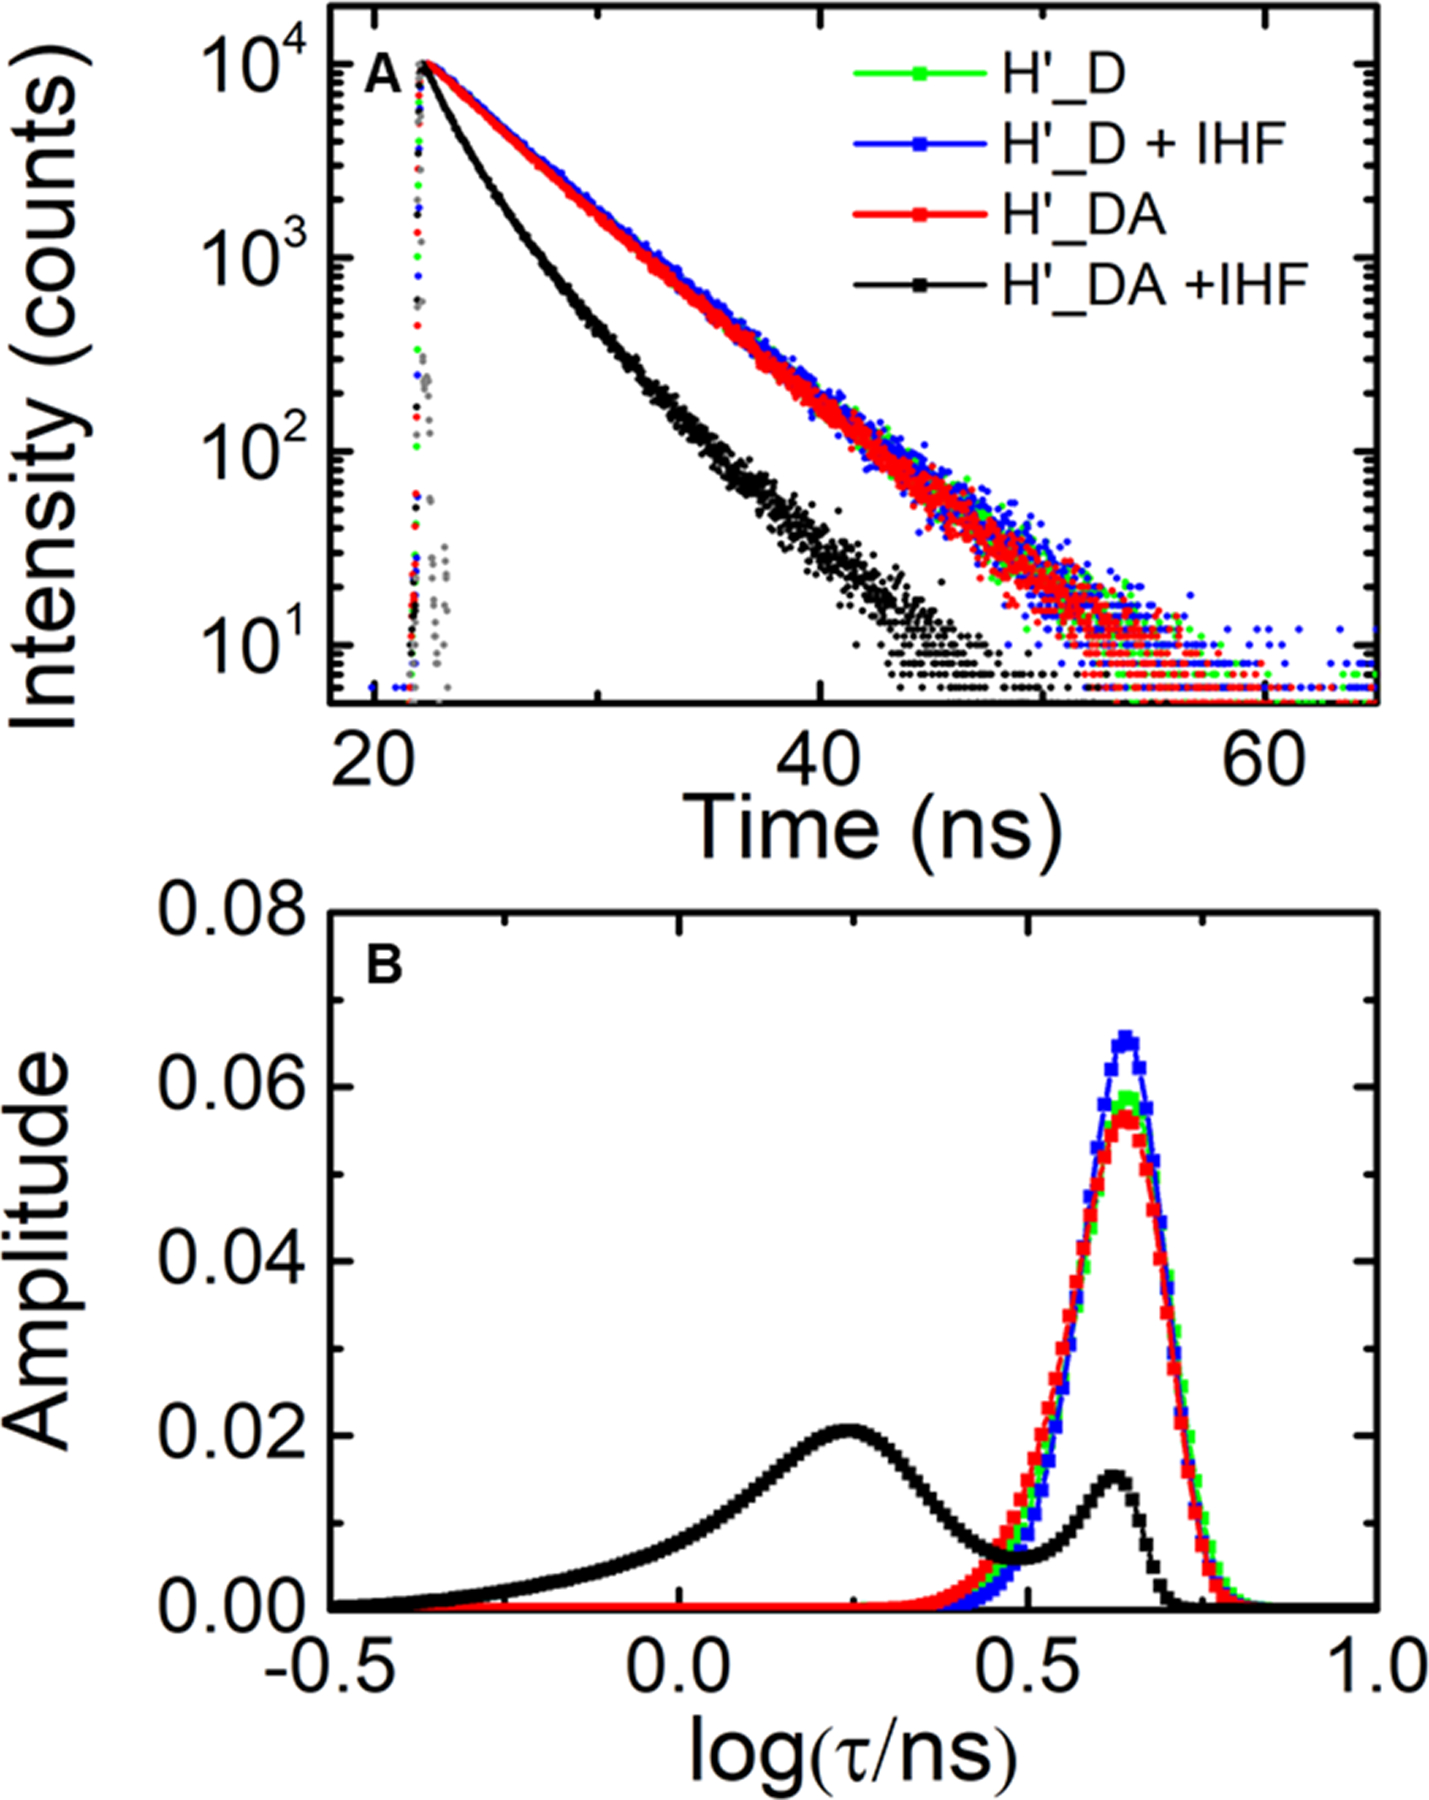
Figure 2.

Fluorescence lifetime measurements on IHF-H’ complex in design I constructs. (A) Fluorescence intensity decay traces measured on H’ labeled with fluorescein and TAMRA (H’_DA) are shown in the absence (red) and presence (black) of IHF. The corresponding donor-only (H’_D) decay traces are also shown in the absence (green) and presence (blue) of IHF. Measurements were done with 5 μM DNA and 5 μM IHF. The instrument response function (gray) is shown for comparison. (B) The MEM lifetime distributions obtained from the fluorescence decay traces are shown. The amplitudes of the distributions are normalized to add up to one.
