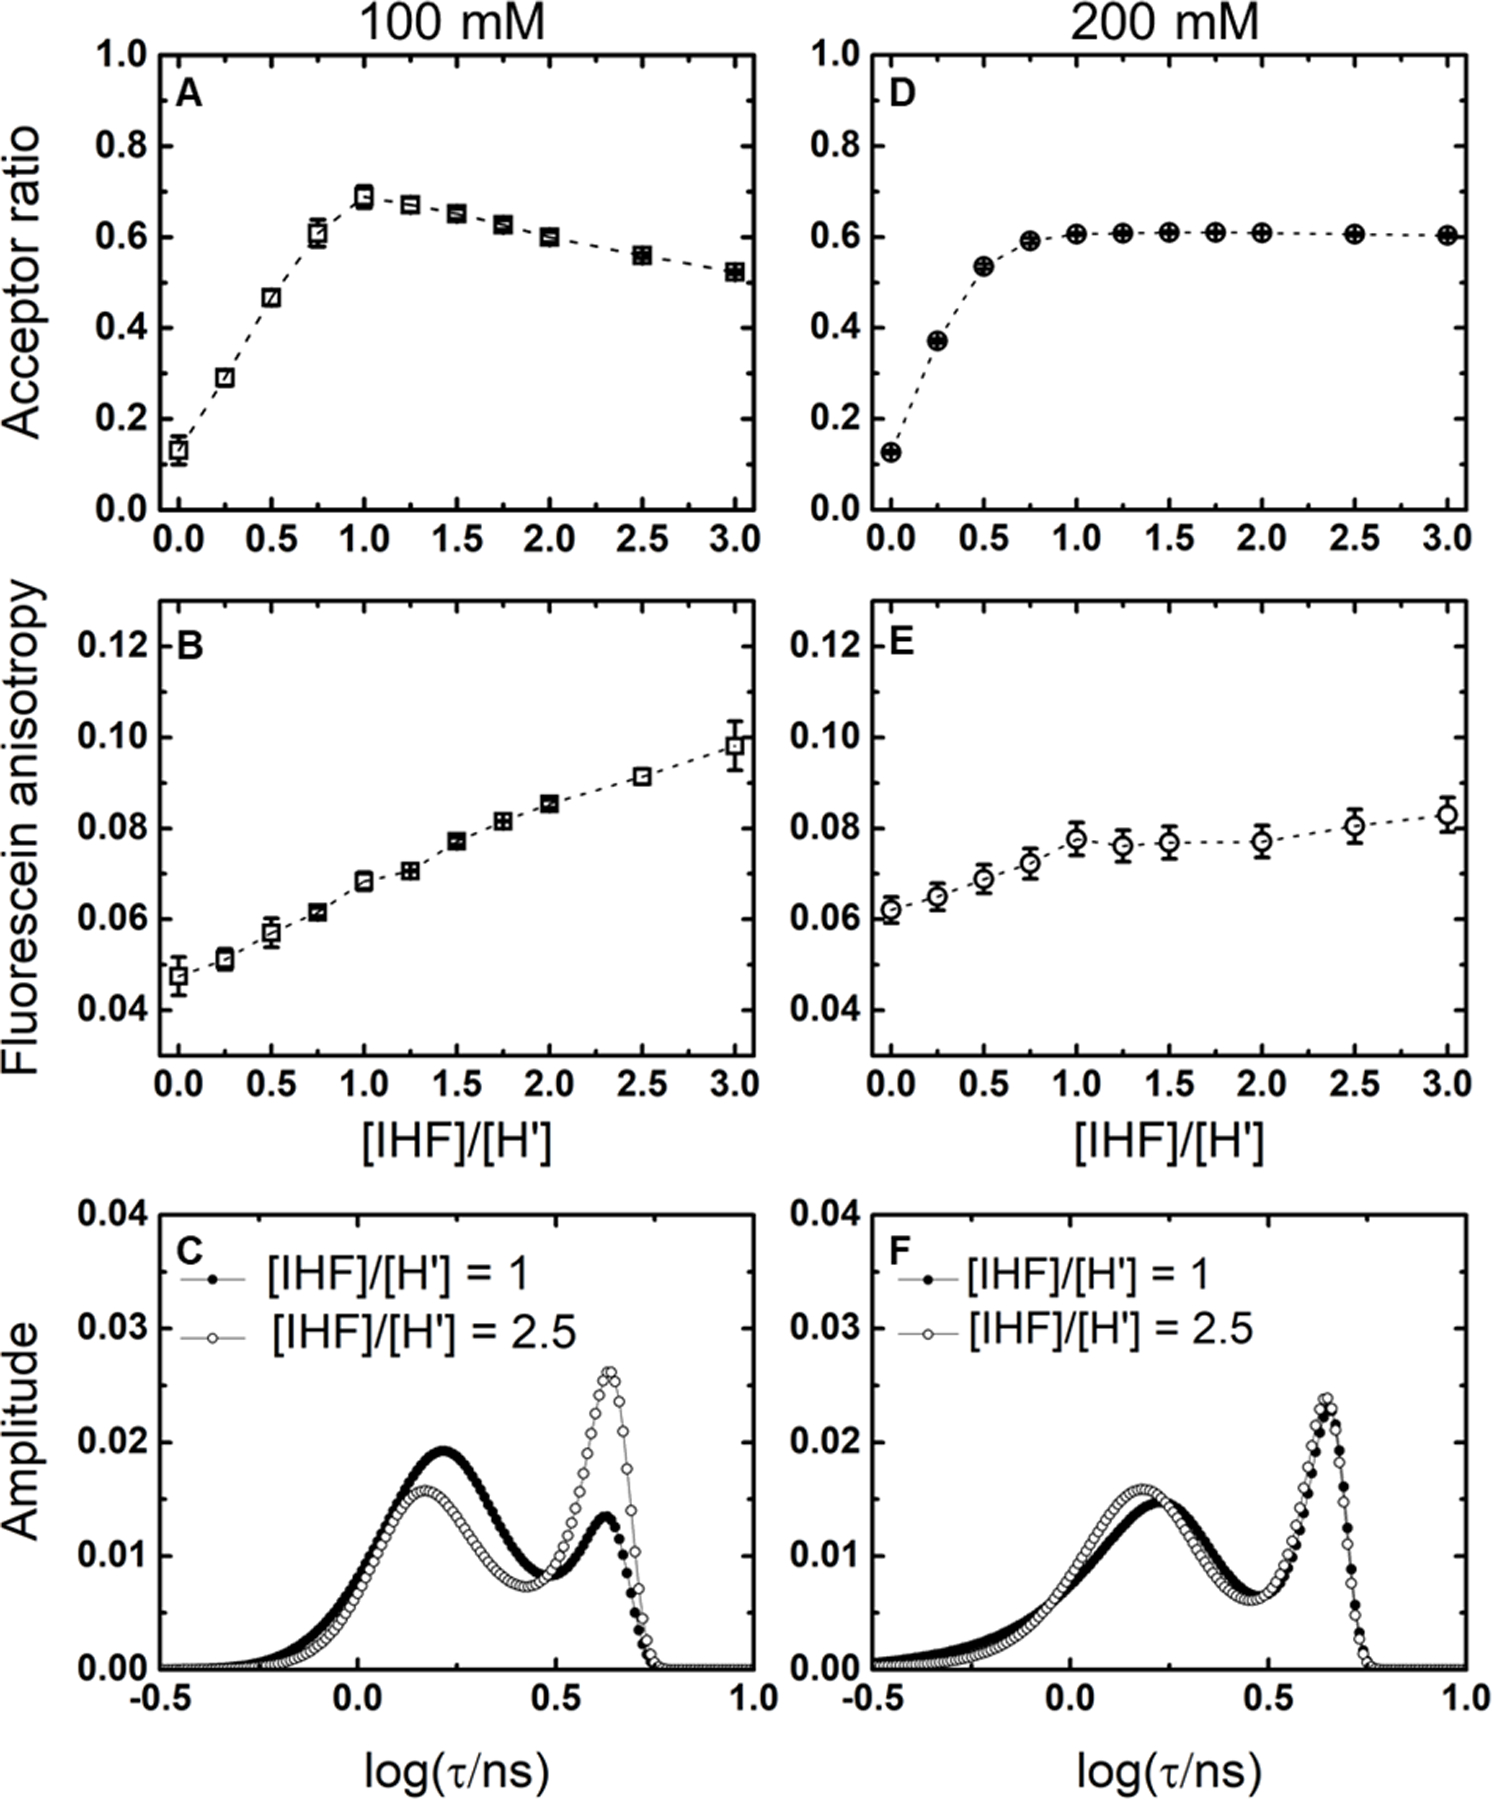
Figure 3.

Binding isotherms and MEM distributions for the IHF-H’ complex at 100 and 200 mM KCl. (A,D) Acceptor ratio measurements and (B,E) anisotropy measurements are shown for 1uM H’_DA and varying concentration of IHF in 100mM KCl (A,B) and 200mM KCl (D,E). (C,F) The MEM lifetime distributions obtained from fluorescence decay traces measured for IHF-H’ are shown for [IHF]/[DNA] = 1 (continuous lines) and [IHF]/[DNA] = 2.5 (dashed lines) in 100 mM KCl (C) and 200 mM KCl (F). DNA concentrations for the lifetime measurements were 5 µM.
