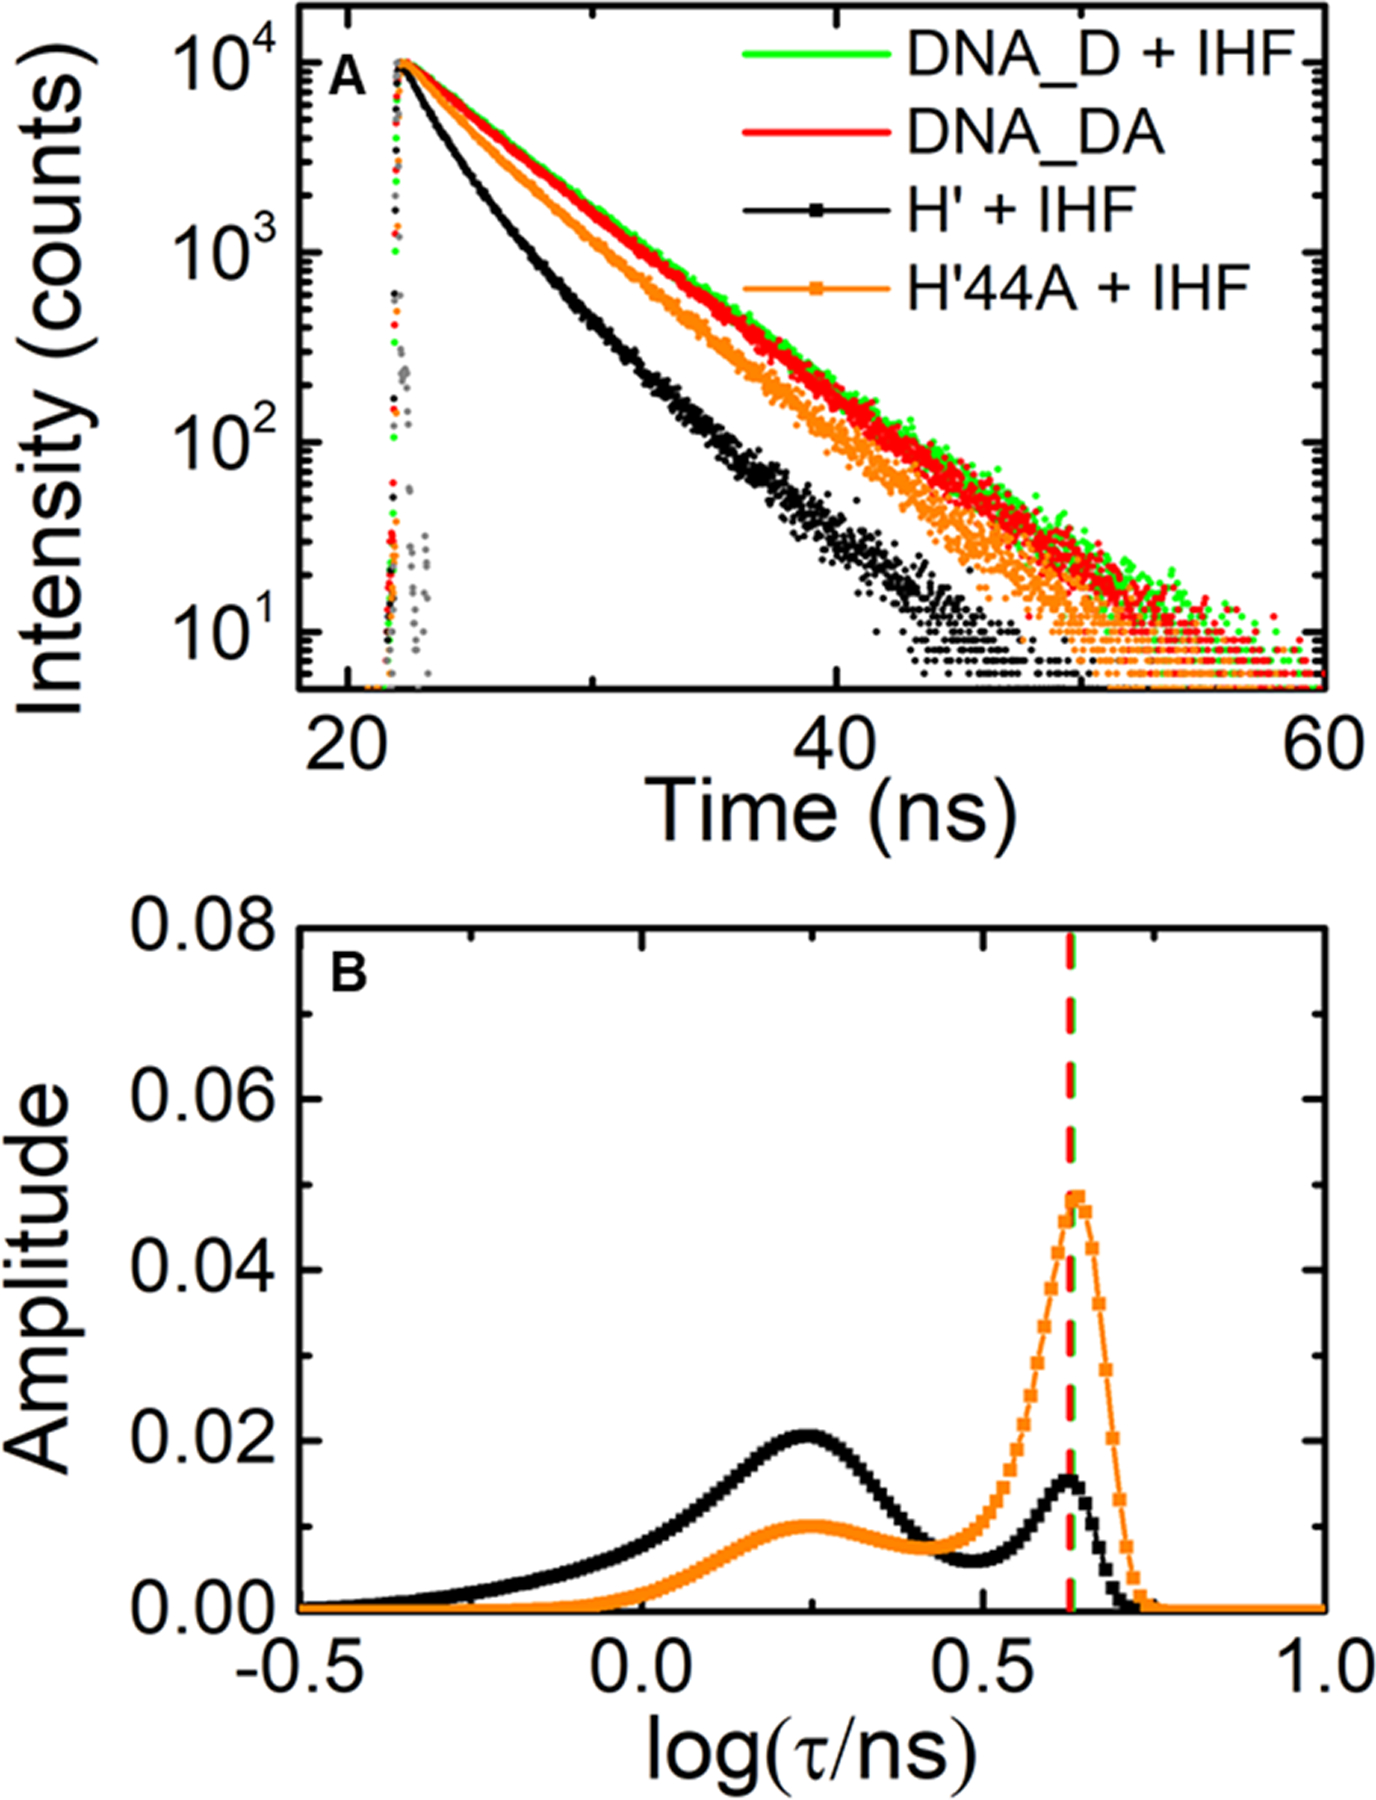
Figure 7.

Fluorescence lifetime measurements on IHF-H’ compared with IHF-H’44A (design I constructs). (A) Fluorescence intensity decay traces measured on H’_DA (black) and H’44A_DA (orange), both in the presence of IHF. Decay traces on DNA_DA in the absence of IHF (red) and DNA_D in presence of IHF (green) are shown for comparison. Measurements were done with 5 μM DNA and 5 μM IHF. The instrument response function (gray) is shown for comparison. (B) The MEM lifetime distributions obtained from fluorescence decay traces measured for H’_DA (black) and H’44A_DA (orange) in the presence of IHF are shown. The amplitudes of the distributions are normalized to add up to one. The average lifetime for the DNA_DA in the absence of IHF (red) and DNA_D in presence of IHF (green) are indicated by the vertical dashed lines.
