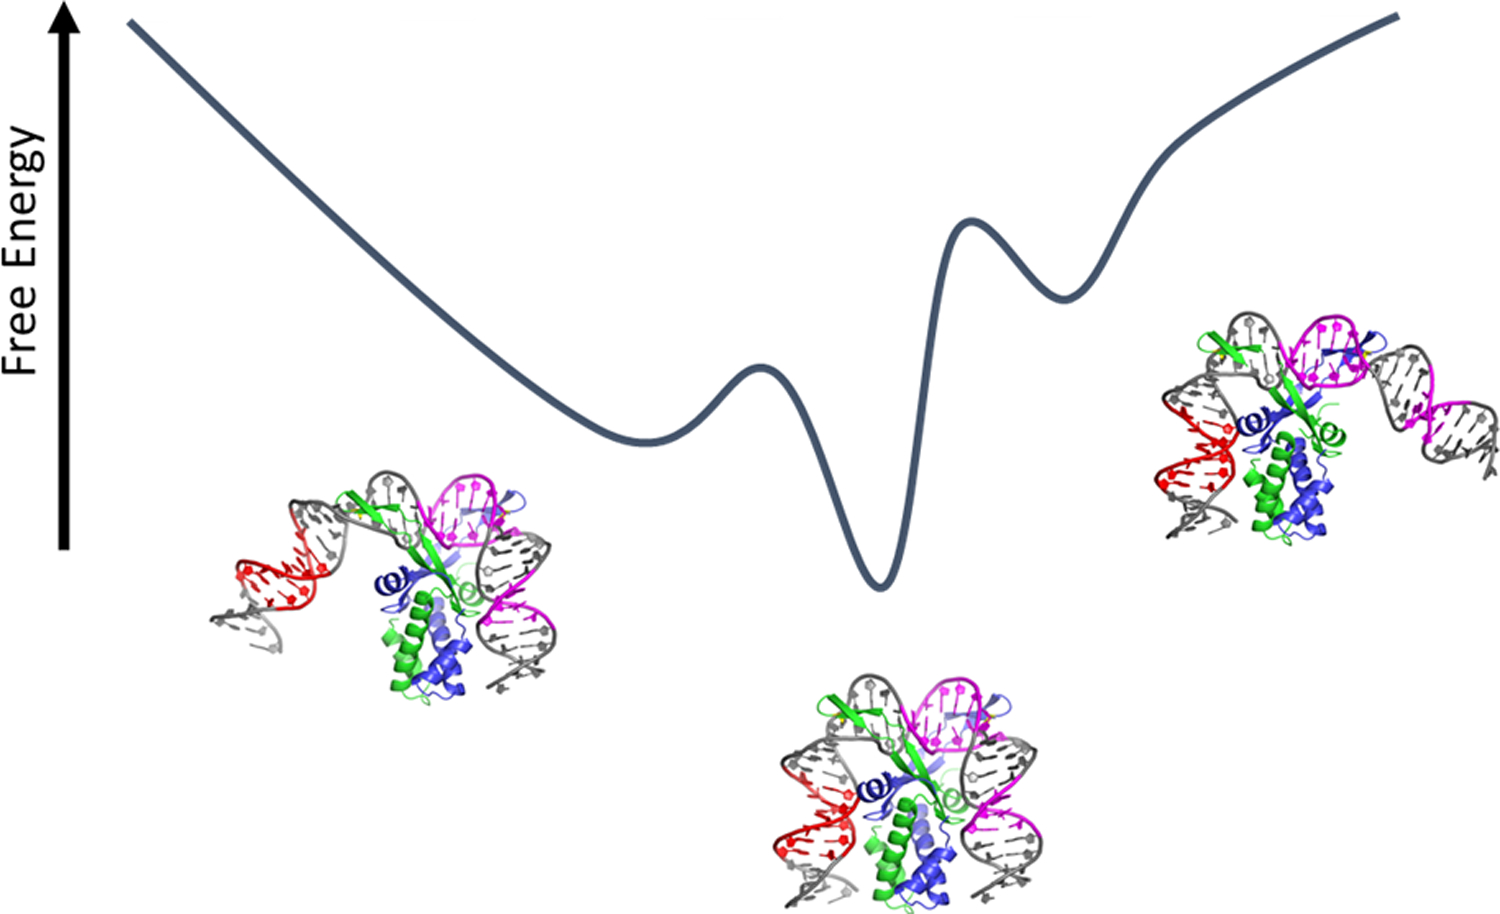
Figure 8.

Schematic representation of the free energy landscape of the specific IHF-DNA complex, with multiple conformations accessible in solution. These conformations include the most stable complex, with two DNA sites kinked, as well as conformations with one or the other side unkinked. The partially bent conformations shown are models of the low-FRET population and not based on real structural data.
