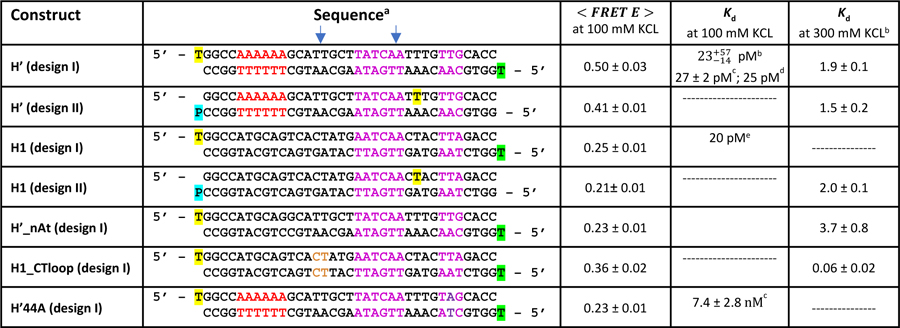
Table 1:
DNA Constructs Used in This Study

|
The blue arrows indicate the position of the kinks in complex with IHF; the yellow- and green-highlighted thymines represent fluorescein- and TAMRA-attachment, respectively, to that base; the blue-highlighted P indicates attachment of Atto550 to the phosphate group; A-tract is shown in red and the consensus sequence in magenta; the position of the mutation in H’44A is indicated in purple; the position of 4-nt loop is H1_CTloop is indicated in brown.
