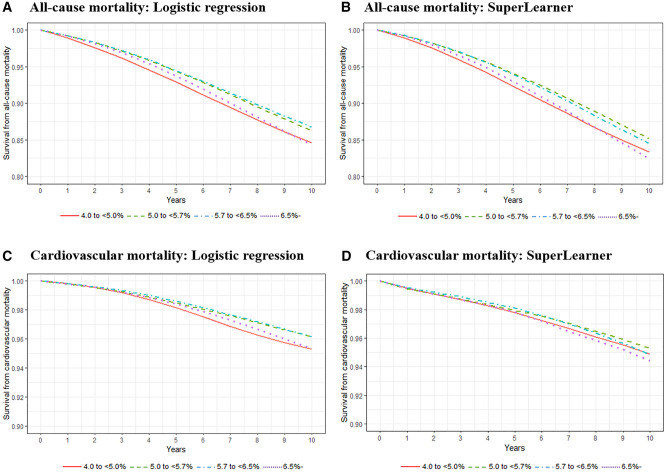
Figure 1.
Adjusted all-cause and cardiovascular mortality risk according to glycated haemoglobin (HbA1c) levels using parametric g-formula with pooled logistic regression models and SuperLearner. The ranges of the survival rate (Y-axis) presented in figures were 0.8 to 1.0 for all-cause mortality and 0.9 to 1.0 for cardiovascular mortality. Robust 95% confidence intervals (CIs) for each HbA1c category estimated by bootstrapping (in the pooled logistic regression model) are presented in Table 3; and in Supplementary Tables S3 and S4, available as Supplementary data at IJE online

