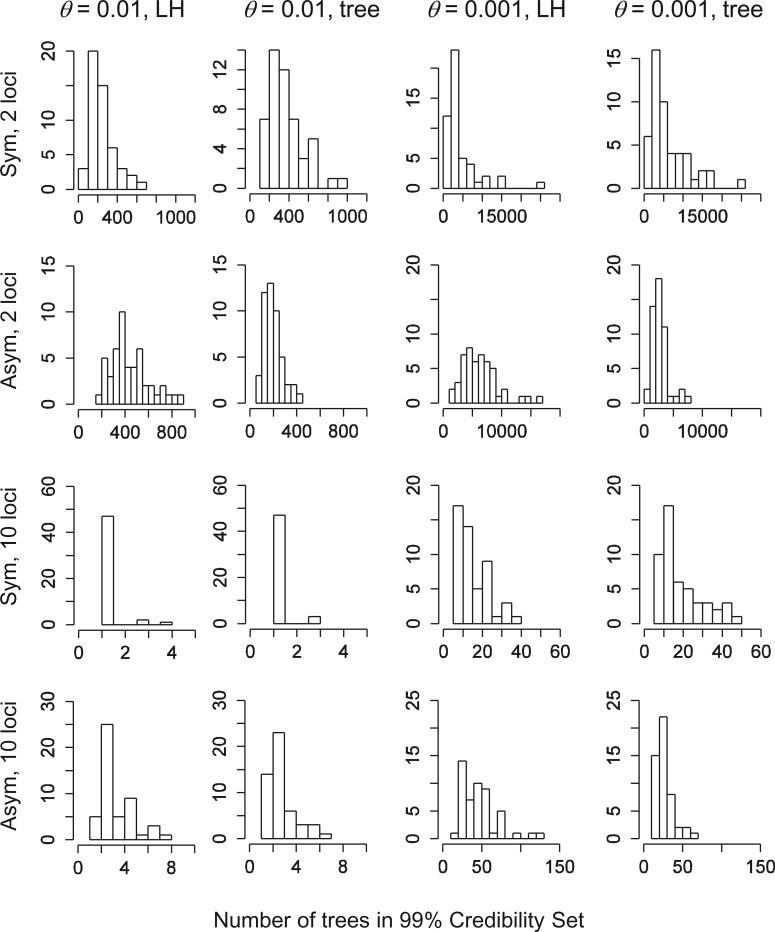
Figure 5.
Histograms of the number of species trees in the 99% credible set from analyses of 50
simulated datasets for each of 8 combinations of simulation conditions and two
different species tree priors: Prior 0 (LH) which assigns equal probabilities to
labeled histories (columns 1 and 3), and prior 1 (tree) which assigns equal
probabilities to rooted species trees (columns 2 and 4). The upper two rows show
results for two loci and and the lower two rows results for 10 loci. Rows 1 and 3 are
results for data simulated on symmetrical (Sym) trees and rows 2 and 4 for
asymmetrical (Asym) trees. The two columns to the left are simulations using
 and the two columns on the
right are those using
  .
.

